Line chart
March 28, 2023
All of the examples on this page have the window resizability set to the content size. This allows the size of the window to be defined by the chart view.
import SwiftUI

@main
struct LineChartApp: App {
    var body: some Scene {
        WindowGroup {
            ContentView()
        }
        .windowResizability(.contentSize)
    }
}
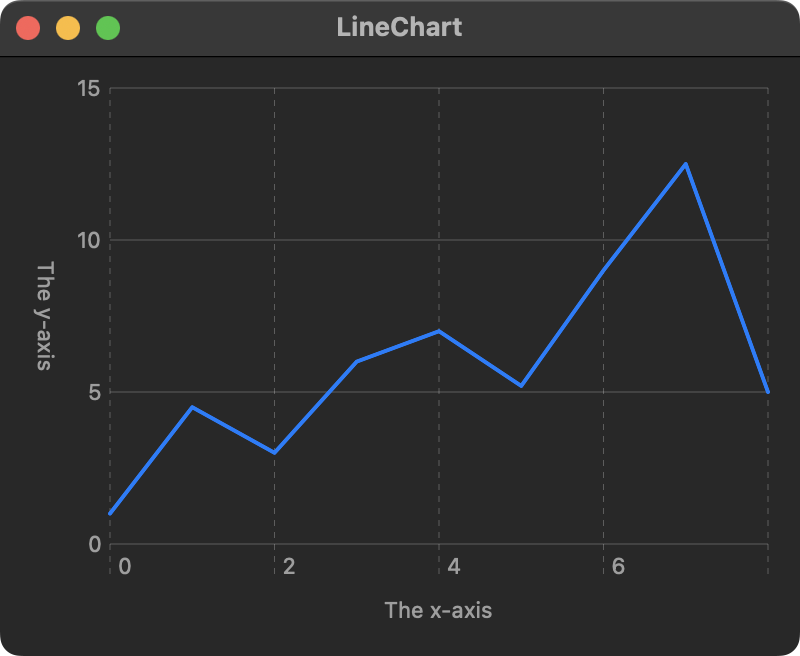
Example 1
A basic line chart using an array of structs is demonstrated below. Notice a minimum frame width and height is used so the chart will change size with the window.

import SwiftUI
import Charts

struct Point: Identifiable {
    let id = UUID()
    let x: Float
    let y: Float
}

let points = [
    Point(x: 0, y: 1),
    Point(x: 1, y: 4.5),
    Point(x: 2, y: 3),
    Point(x: 3, y: 6),
    Point(x: 4, y: 7),
    Point(x: 5, y: 5.2),
    Point(x: 6, y: 9),
    Point(x: 7, y: 12.5),
    Point(x: 8, y: 5)
]

struct ContentView: View {

    var body: some View {
        Chart(points) { point in
            LineMark(
                x: .value("X values", point.x),
                y: .value("Y values", point.y)
            )
        }
        .chartXAxisLabel("The x-axis")
        .chartYAxisLabel("The y-axis")
        .padding()
        .frame(minWidth: 400, minHeight: 300)
    }
}
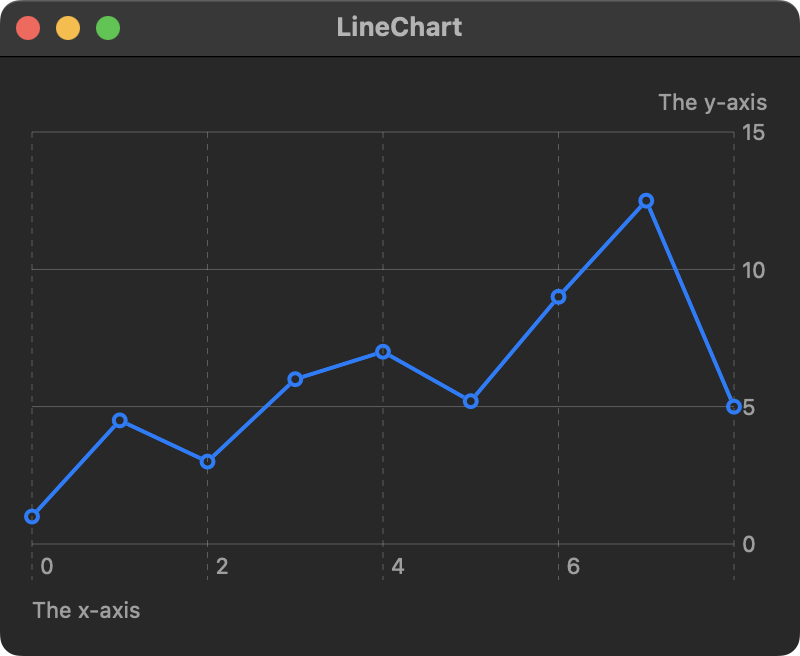
Example 2
In this example, a ForEach loop is used with an array of structs. The x and y axis labels are centered and the y axis is moved to the left side of the chart view.
import SwiftUI
import Charts

struct Point: Identifiable {
    let id = UUID()
    let x: Float
    let y: Float
}

let points = [
    Point(x: 0, y: 1),
    Point(x: 1, y: 4.5),
    Point(x: 2, y: 3),
    Point(x: 3, y: 6),
    Point(x: 4, y: 7),
    Point(x: 5, y: 5.2),
    Point(x: 6, y: 9),
    Point(x: 7, y: 12.5),
    Point(x: 8, y: 5)
]

struct ContentView: View {

    var body: some View {
        Chart {
            ForEach(points) { point in
                LineMark(
                    x: .value("X values", point.x),
                    y: .value("Y values", point.y)
                )
            }
        }
        .chartXAxisLabel("The x-axis", alignment: .center)
        .chartYAxisLabel("The y-axis", position: .leading)
        .chartYAxis {
            AxisMarks(position: .leading)
        }
        .padding()
        .frame(minWidth: 400, minHeight: 300)
    }
}
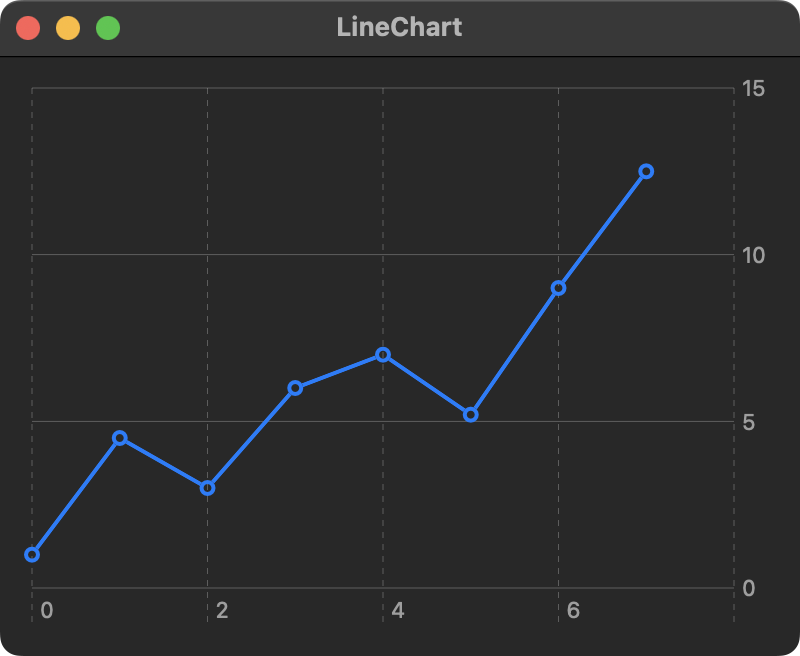
Example 3
For this example, the chart data is provided has an array of tuple values and circle symbols represent each data point on the line.
import SwiftUI
import Charts

let y = [1, 4.5, 3, 6, 7, 5.2, 9, 12.5, 5]

var data: [(Int, Double)] {
    let x = Array(0..<y.count)
    return Array(zip(x, y))
}

struct ContentView: View {

    var body: some View {
        Chart(data, id: \.0) {
            LineMark(
                x: .value("X values", $0),
                y: .value("Y values", $1)
            )
            .symbol(.circle)
        }
        .chartXAxisLabel("The x-axis")
        .chartYAxisLabel("The y-axis")
        .padding()
        .frame(minWidth: 400, minHeight: 300)
    }
}
Example 4
In this example, the chart data is just an array of values where circle symbols represent each data point on the line.
import SwiftUI
import Charts

struct ContentView: View {

    let ydata = [1, 4.5, 3, 6, 7, 5.2, 9, 12.5]

    var body: some View {
        Chart(0..<ydata.count, id: \.self) { idx in
            LineMark(
                x: .value("X values", idx),
                y: .value("Y values", ydata[idx])
            )
            .symbol(.circle)
        }
        .padding()
        .frame(minWidth: 400, minHeight: 300)
    }
}
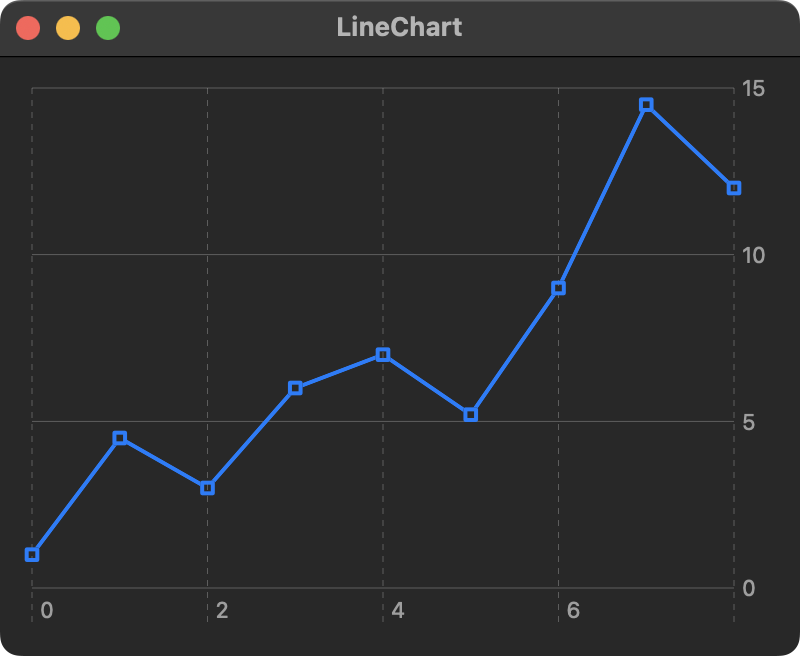
Example 5
Here is an example that uses an enumerated array for the chart data and square symbols represent each data point on the line.
import SwiftUI
import Charts

struct ContentView: View {

    let numbers = [1, 4.5, 3, 6, 7, 5.2, 9, 14.5, 12]

    var body: some View {
        Chart(Array(numbers.enumerated()), id: \.offset) { index, value in
            LineMark(
                x: .value("Index", index),
                y: .value("Value", value)
            )
            .symbol(.square)
        }
        .padding()
        .frame(minWidth: 400, minHeight: 300)
    }
}
Swift Programming for macOS © 2025
Built with Genja by Gavin Wiggins