View data with Matplotlib
February 4, 2023
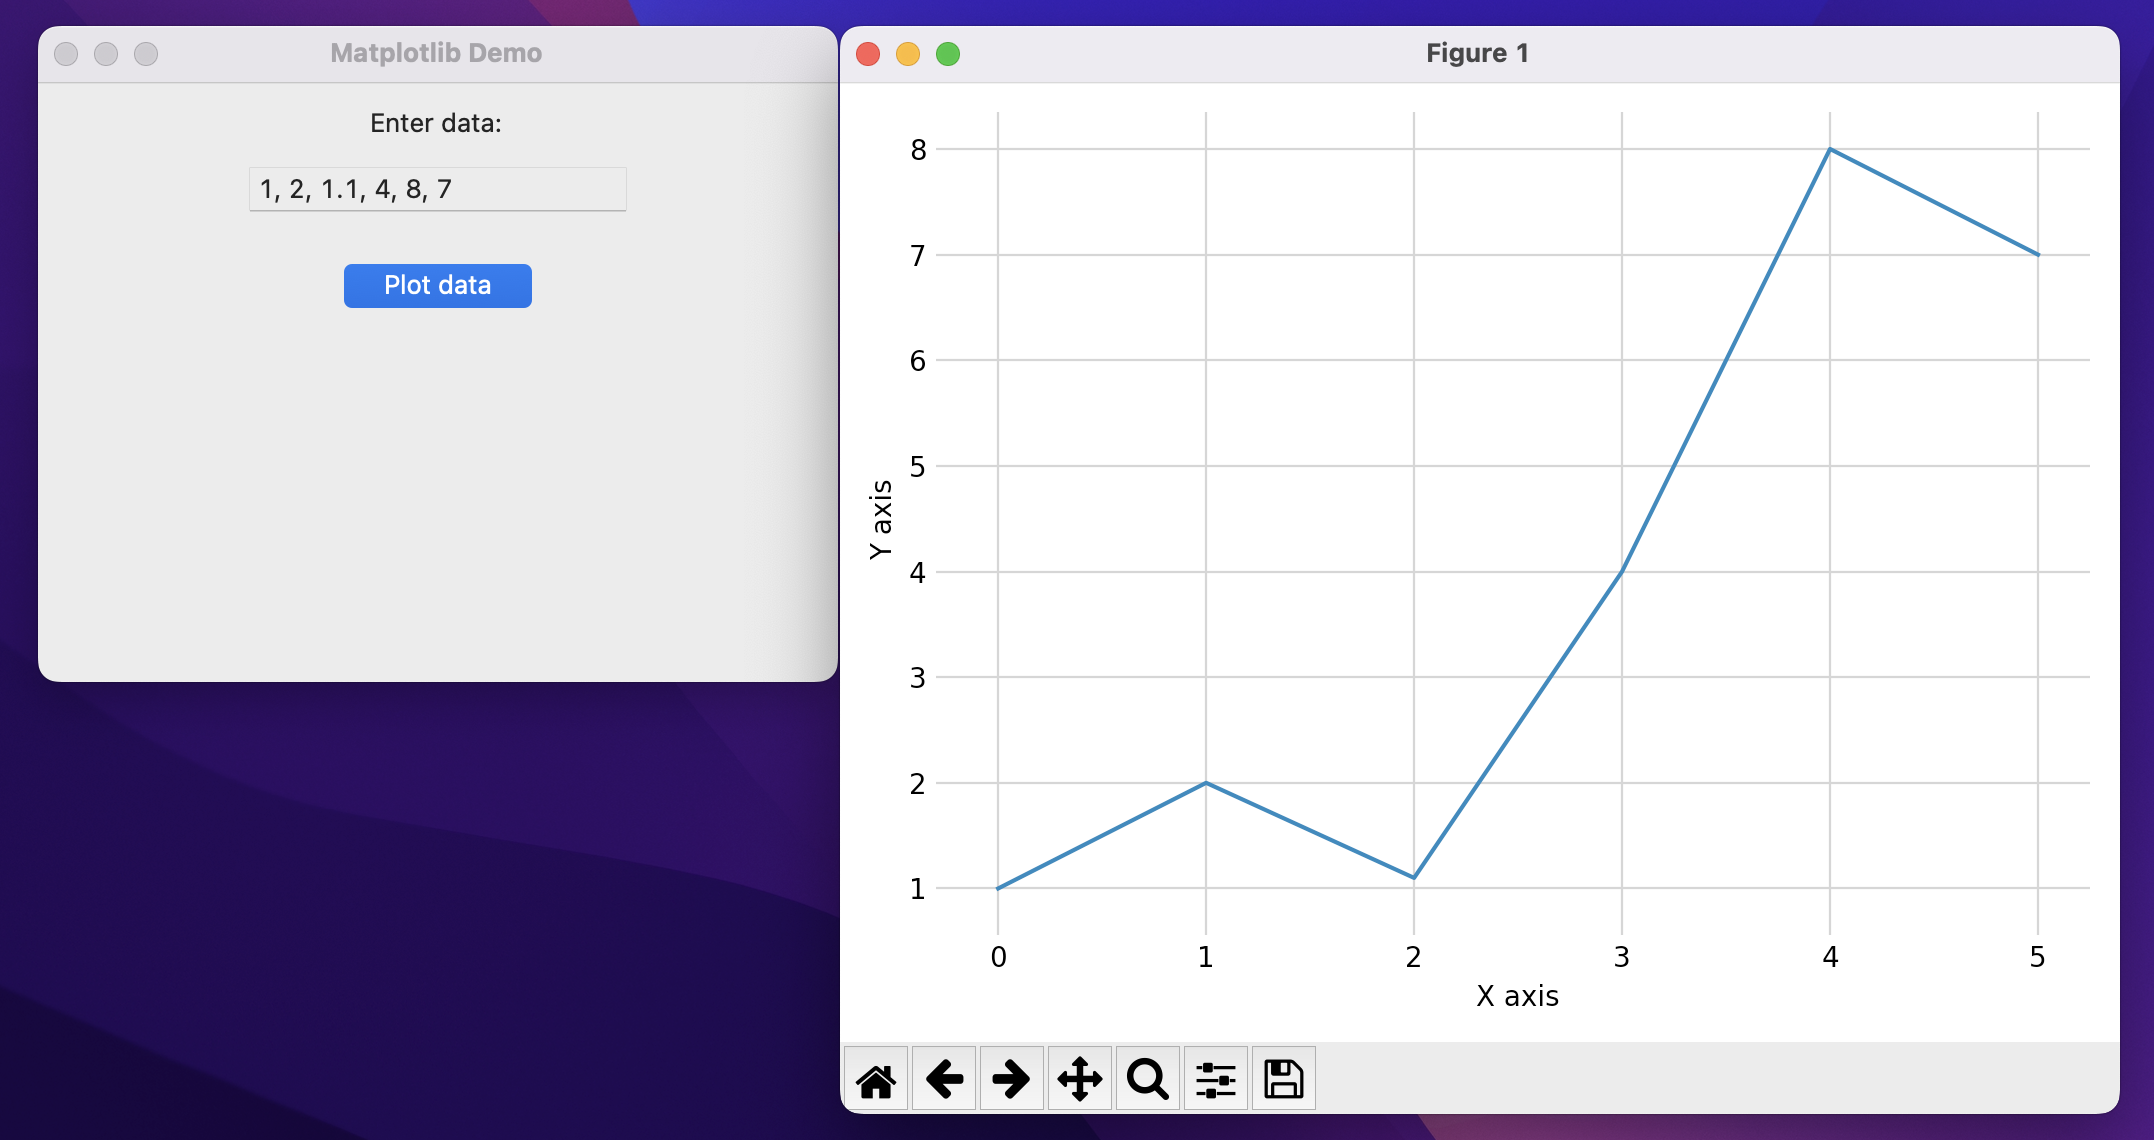
Below is an example of using Matplotlib to plot data in a Tkinter app. The plot figure is shown in a separate window when the button is pressed.
import tkinter as tk
from tkinter import ttk
import matplotlib.pyplot as plt


class MyApp:

    def __init__(self, root):
        self.root = root
        self.data = tk.StringVar()
        self.configure_window()
        self.create_widgets()

    def configure_window(self):
        self.root.title('Matplotlib Demo')
        self.root.geometry('400x300')
        self.root.resizable(False, False)

    def create_widgets(self):
        ttk.Label(text='Enter data:').pack(pady=10)
        ttk.Entry(textvariable=self.data).pack()
        ttk.Button(text='Plot data', command=self.create_plot).pack(pady=20)

    def create_plot(self):
        # Get numbers from entry
        data = self.data.get().split(', ')
        numbers = list(map(float, data))

        # Create plot
        fig, ax = plt.subplots(tight_layout=True)
        ax.plot(numbers)
        ax.set_xlabel('X axis')
        ax.set_ylabel('Y axis')
        ax.grid(color='0.8')
        ax.set_frame_on(False)
        ax.tick_params(color='0.8')

        # Show window containing the plot figure
        plt.show()


if __name__ == '__main__':
    root = tk.Tk()
    MyApp(root)
    root.mainloop()
Pythonic Programming © 2024
Built by Gavin Wiggins