Plotly Graph Restyle with Flask
February 4, 2023
Plotly is a great graphing library for scientific applications. The example below demonstrates using the Plotly JavaScript library in a Flask app. When the page first loads, a default line graph is shown. New data points are added to the graph using the form inputs. The Plotly.restyle function is used to redraw the graph when new data points are submitted; this approach avoids recreating an entirely new Plotly graph each time the data is updated.
The main Flask app is shown below. The update() route sends the x and y values from the form inputs as JSON which is used to update the Plotly line graph data.
# app.py

from flask import Flask
from flask import render_template
from flask import request
from flask import jsonify


app = Flask(__name__)


@app.route('/')
def index():
    return render_template('index.html')


@app.route('/update', methods=['POST'])
def update():
    xdata = request.form['xdata']
    ydata = request.form['ydata']

    x = list(map(float, xdata.split(', ')))
    y = list(map(float, ydata.split(', ')))

    res = {'xValues': x, 'yValues': y}

    return jsonify(res)
The HTML index page is shown below. The form submits a POST request and calls the updateGraph() JavaScript function while the #graphDiv is where the Plotly graph is displayed.
<!-- templates/index.html -->
<!DOCTYPE html>
<html lang="en">
<head>
<meta charset="utf-8">
<meta name="viewport" content="width=device-width, initial-scale=1">
<link href="https://cdn.jsdelivr.net/npm/bootstrap@5.1.3/dist/css/bootstrap.min.css" rel="stylesheet" integrity="sha384-1BmE4kWBq78iYhFldvKuhfTAU6auU8tT94WrHftjDbrCEXSU1oBoqyl2QvZ6jIW3" crossorigin="anonymous">
<title>Home Page</title>
<style type="text/css">
body { background-color: lightgray; }
input { max-width: 200px; }
</style>
</head>
<body>
<div class="container">
<div class="row">
<div class="col">
<h1 class="mt-3">Submit data</h1>
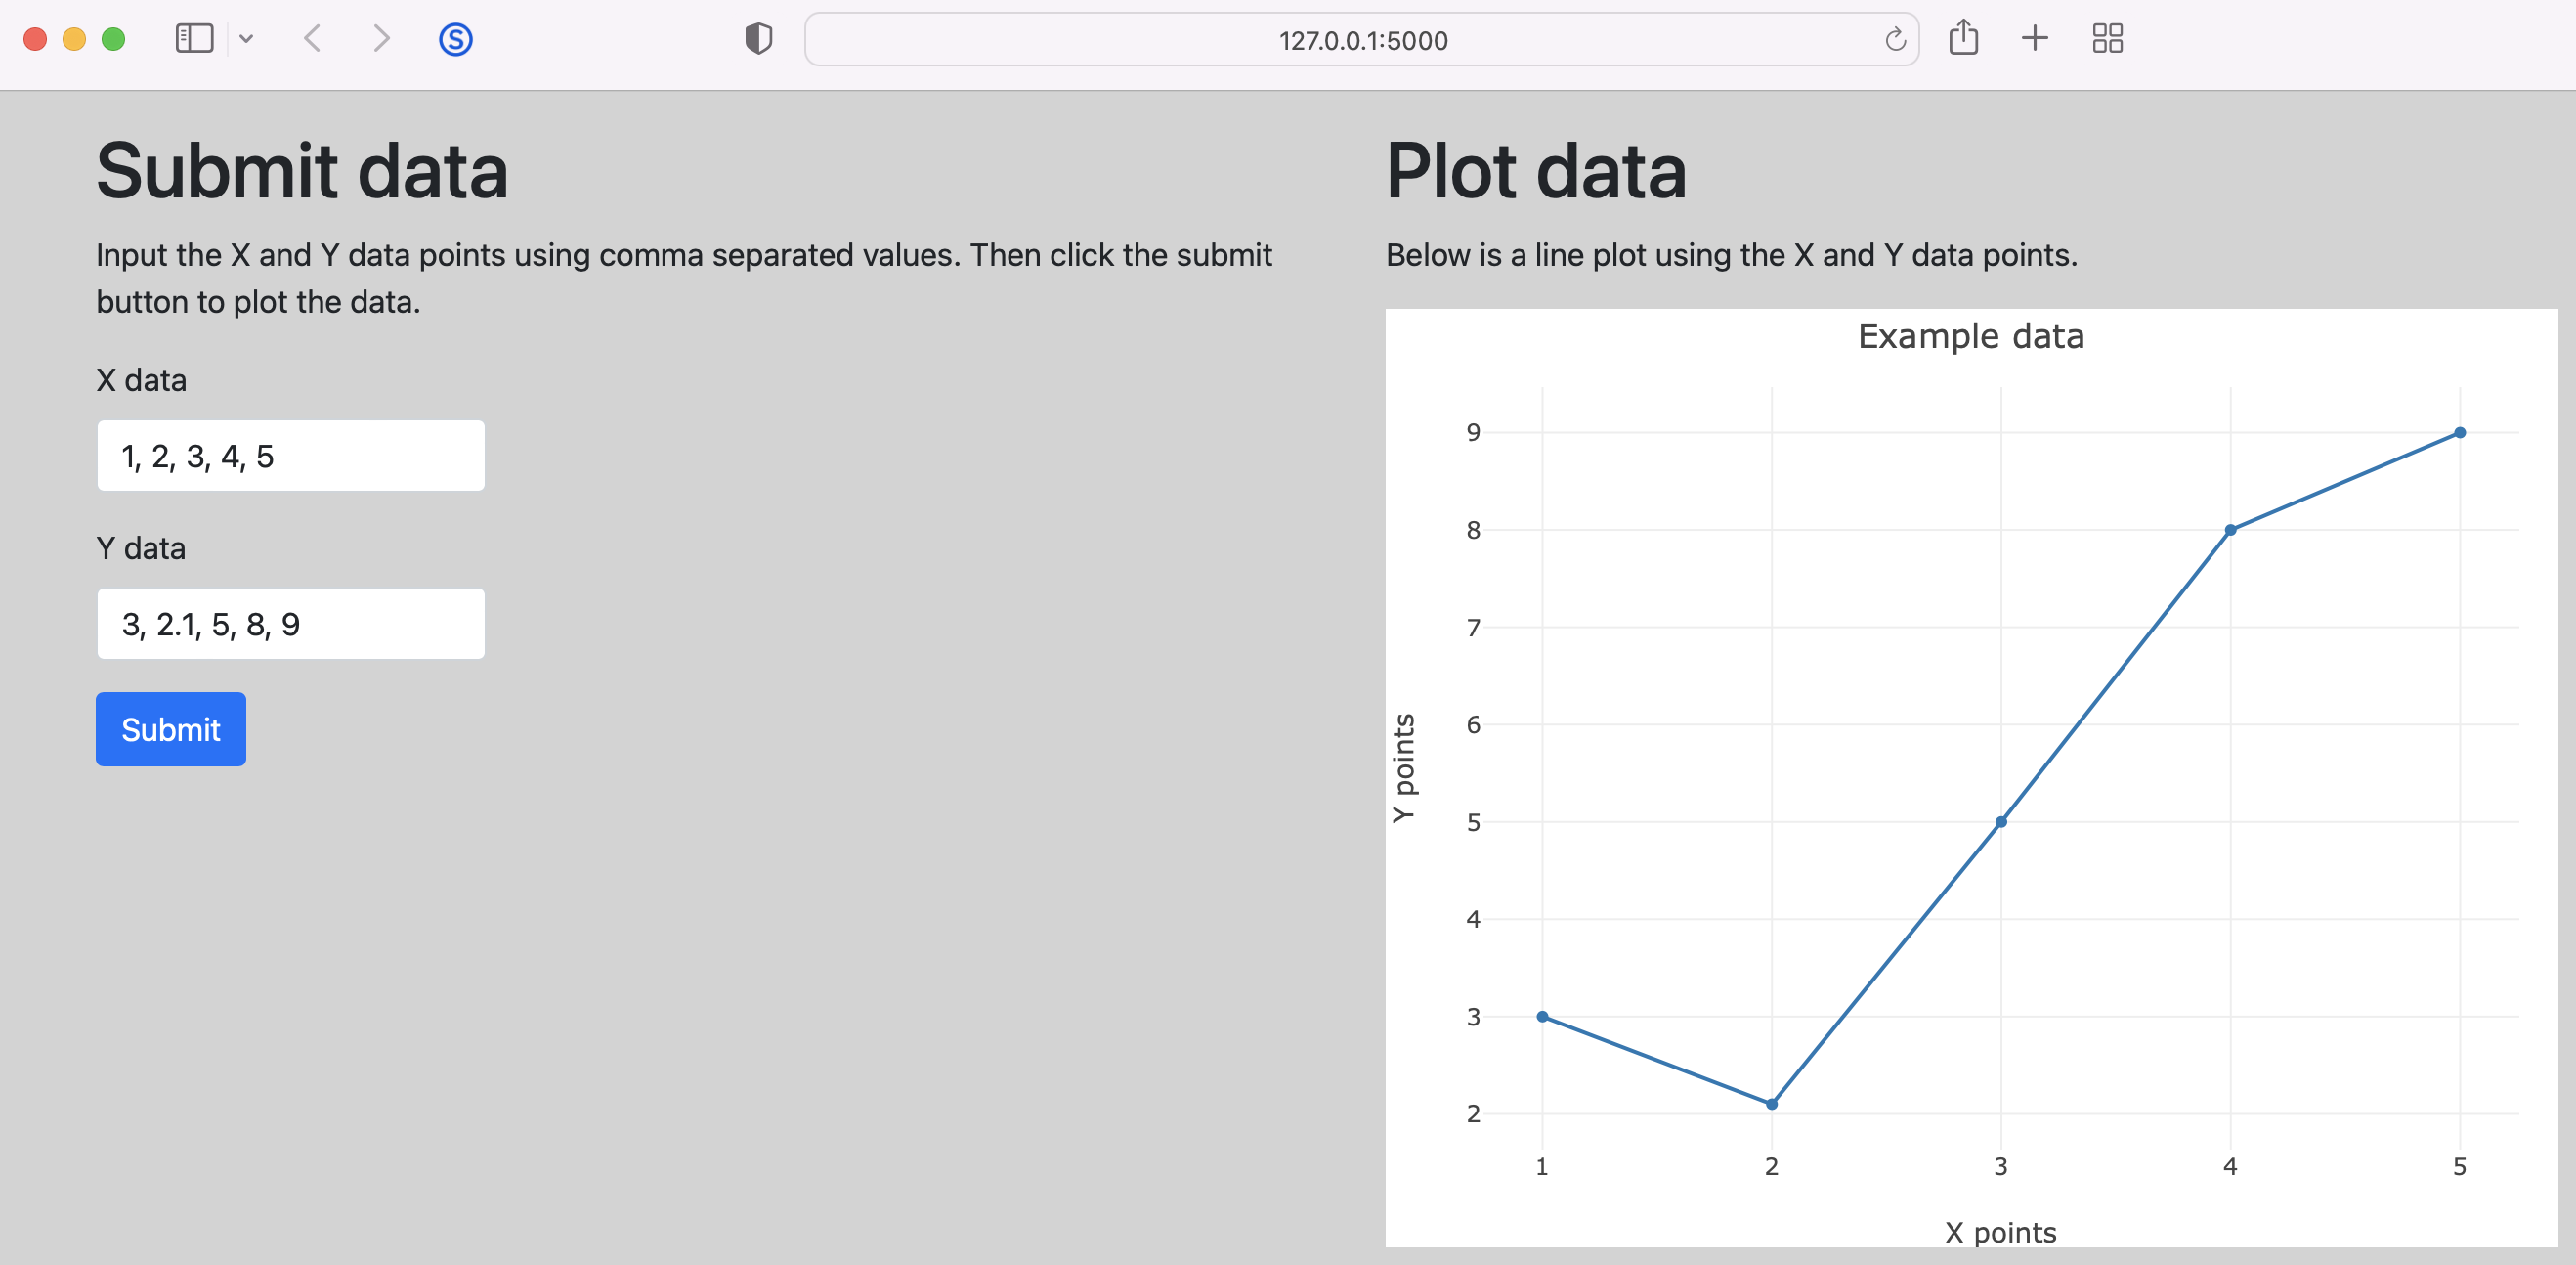
<p>Input the X and Y data points using comma separated values. Then click the submit button to plot the data.</p>
<form method="POST" action="/update" onsubmit="updateGraph()">
<div class="mb-3">
<label for="xdata" class="form-label">X data</label>
<input type="text" class="form-control" name="xdata" value="1, 2, 3, 4, 5">
</div>
<div class="mb-3">
<label for="ydata" class="form-label">Y data</label>
<input type="text" class="form-control" name="ydata" value="3, 2.1, 5, 8, 9">
</div>
<button type="submit" class="btn btn-primary">Submit</button>
</form>
</div>
<div class="col">
<h1 class="mt-3">Plot data</h1>
<p>Below is a line plot using the X and Y data points.</p>
<div id="graphDiv" style="width:600px;height:480px;"></div>
</div>
</div>
</div>
<script src="https://cdn.plot.ly/plotly-2.8.3.min.js"></script>
<script src="{% raw %}{{ url_for('static', filename='graph.js') }}{% endraw %}"></script>
</body>
</html>
The JavaScript for creating the Plotly graph is shown below. The updateGraph() is called when the HTML form is submitted. This function uses the JavaScript fetch() method to handle the response from the POST request. Finally, the line graph is updated with the new x and y data using Plotly.restyle().
// static/graph.js

window.onload(showGraph());

function showGraph() {
    var data = [{
        x: [1, 2, 3, 4, 5],
        y: [3, 2.1, 5, 8, 9],
        type: "line"
    }];

    var layout = {
        title: "Example data",
        xaxis: {
            title: "X points"
        },
        yaxis: {
            title: "Y points"
        },
        margin: {l: 50, r: 20, b: 50, t: 40}
    };

    Plotly.newPlot("graphDiv", data, layout);
}

function updateGraph() {

    const formData = new FormData();
    formData.append("xdata", document.getElementsByName("xdata")[0].value);
    formData.append("ydata", document.getElementsByName("ydata")[0].value);

    fetch("/update", {
        method: "POST",
        body: formData
    })
    .then(response => response.json())
    .then(jsonData => {
        var update = {
            x: [jsonData.xValues],
            y: [jsonData.yValues]
        };

        Plotly.restyle("graphDiv", update);
    });

    event.preventDefault();
}
Pythonic Programming © 2025
Built with Genja by Gavin Wiggins