Gavin Wiggins
Bokeh Graphs and Htmx with Flask
Written on February 4, 2023
Bokeh is a visualization library for Python that makes it easy to plot data in Jupyter notebooks or web pages. Htmx allows you to develop dynamic, interactive web pages without complex JavaScript. The examples in the following sections demonstrate using Flask with Bokeh graphs and Htmx interactivity.
Bokeh example
The example below uses Flask to serve a web page, handle the form input data, then plot the data on a separate page using Bokeh.
The main Flask app is shown below. The form inputs are converted to lists of float values which are used to create the Bokeh plot. To render the Bokeh plot on a web page, it is converted to HTML components that are passed the template.
# app.py

from flask import Flask
from flask import render_template
from flask import request

from bokeh.plotting import figure
from bokeh.embed import components


app = Flask(__name__)


@app.route('/')
def index():
    return render_template('index.html')


@app.route('/plot', methods=['POST'])
def plot():
    # Get the form inputs
    xdata = request.form['xdata']
    ydata = request.form['ydata']

    # Convert form input to a list of floats representing x and y values
    x = list(map(float, xdata.split(', ')))
    y = list(map(float, ydata.split(', ')))

    # Create a Bokeh plot using the x and y values
    p = figure(plot_width=400, plot_height=400)
    p.circle(x, y, size=12, line_color='navy', fill_color='orange')

    # Get HTML components to embed in a web page
    script, div = components(p)

    return render_template('plot.html', script=script, div=div)
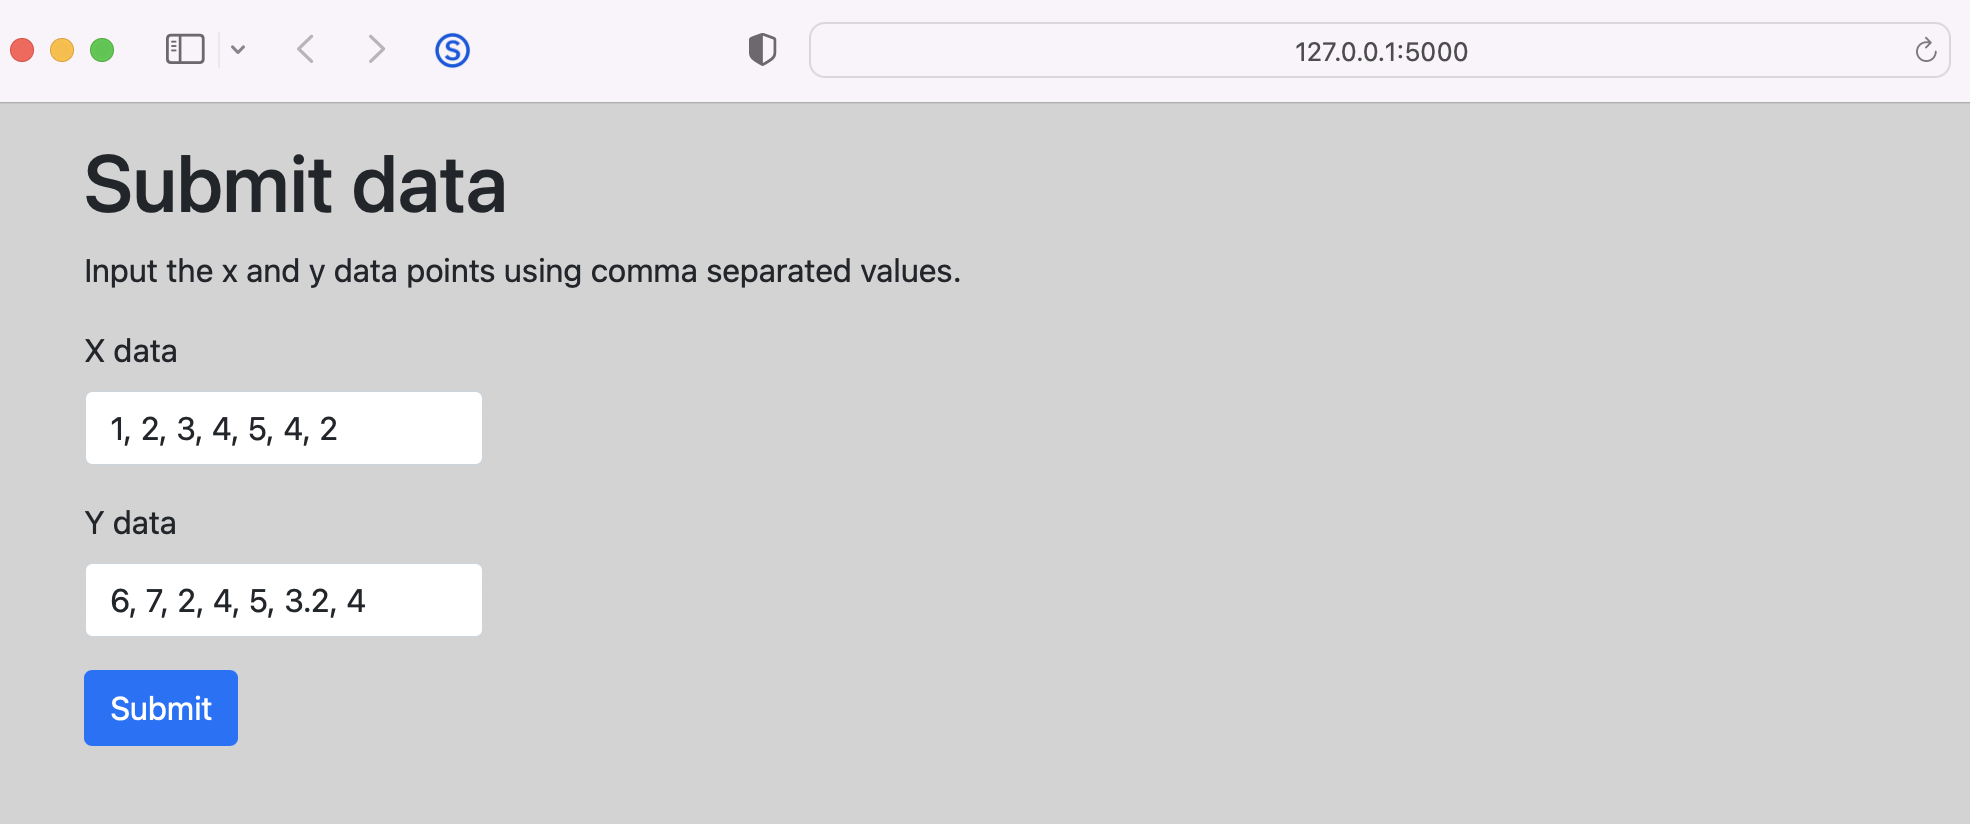
The home page (index) template contains a form where the user inputs the x and y values.
<!-- templates/index.html -->

<!DOCTYPE html>
<html lang="en">
<head>
    <meta charset="utf-8">
    <meta name="viewport" content="width=device-width, initial-scale=1">
    <link href="https://cdn.jsdelivr.net/npm/bootstrap@5.1.3/dist/css/bootstrap.min.css" rel="stylesheet" integrity="sha384-1BmE4kWBq78iYhFldvKuhfTAU6auU8tT94WrHftjDbrCEXSU1oBoqyl2QvZ6jIW3" crossorigin="anonymous">

    <title>Home Page</title>

    <style type="text/css">
        body { background-color: lightgray; }
        input { max-width: 200px; }
    </style>
</head>
<body>
    <div class="container">
        <div class="row">
            <div class="col">

                <h1 class="mt-3">Submit data</h1>

                <p>Input the x and y data points using comma separated values.</p>

                <form action="/plot" method="POST">
                    <div class="mb-3">
                        <label for="xdata" class="form-label">X data</label>
                        <input type="text" class="form-control" name="xdata" value="1, 2, 3, 4, 5, 4, 2">
                    </div>
                    <div class="mb-3">
                        <label for="ydata" class="form-label">Y data</label>
                        <input type="text" class="form-control" name="ydata" value="6, 7, 2, 4, 5, 3.2, 4">
                    </div>
                    <button type="submit" class="btn btn-primary">Submit</button>
                </form>

            </div>
        </div>
    </div>
</body>
</html>
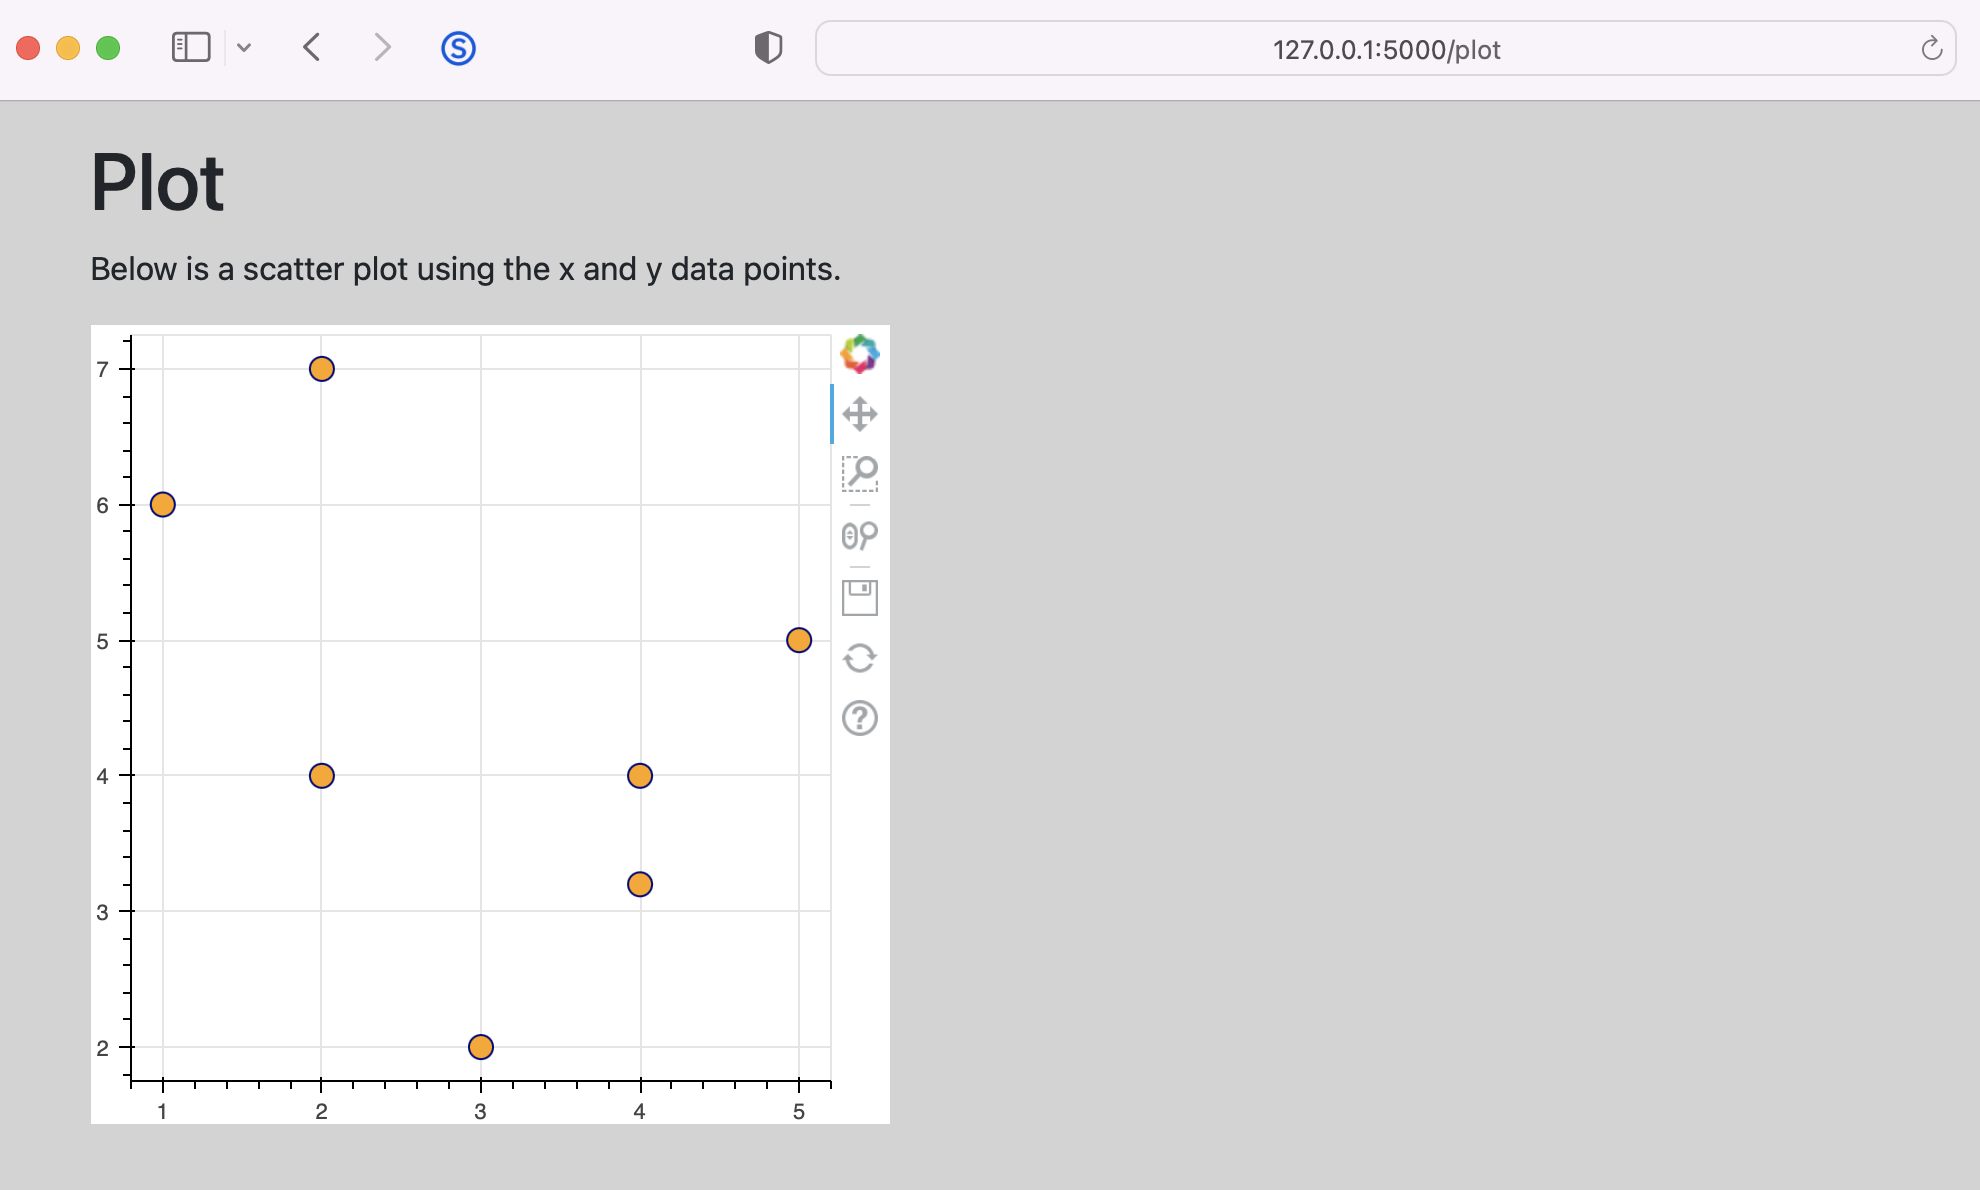
When the submit button is clicked or tapped, the x and y values are used to create a Bokeh plot on a separate page using the plot template which is shown below.
<!-- templates/plot.html -->

<!DOCTYPE html>
<html lang="en">
<head>
    <meta charset="utf-8">
    <meta name="viewport" content="width=device-width, initial-scale=1">
    <link href="https://cdn.jsdelivr.net/npm/bootstrap@5.1.3/dist/css/bootstrap.min.css" rel="stylesheet" integrity="sha384-1BmE4kWBq78iYhFldvKuhfTAU6auU8tT94WrHftjDbrCEXSU1oBoqyl2QvZ6jIW3" crossorigin="anonymous">
    <script src="https://cdn.bokeh.org/bokeh/release/bokeh-2.4.2.min.js" crossorigin="anonymous"></script>

    <title>Plot Page</title>

    <style type="text/css">
        body { background-color: lightgray; }
    </style>
</head>
<body>
    <div class="container">
        <div class="row">
            <div class="col">

                <h1 class="mt-3">Plot</h1>

                <p>Below is a scatter plot using the x and y data points.</p>

                {% raw %}{{ script | safe }}{% endraw %}

                {% raw %}{{ div | safe }}{% endraw %}
            </div>
        </div>
    </div>
</body>
</html>
Bokeh example with Htmx
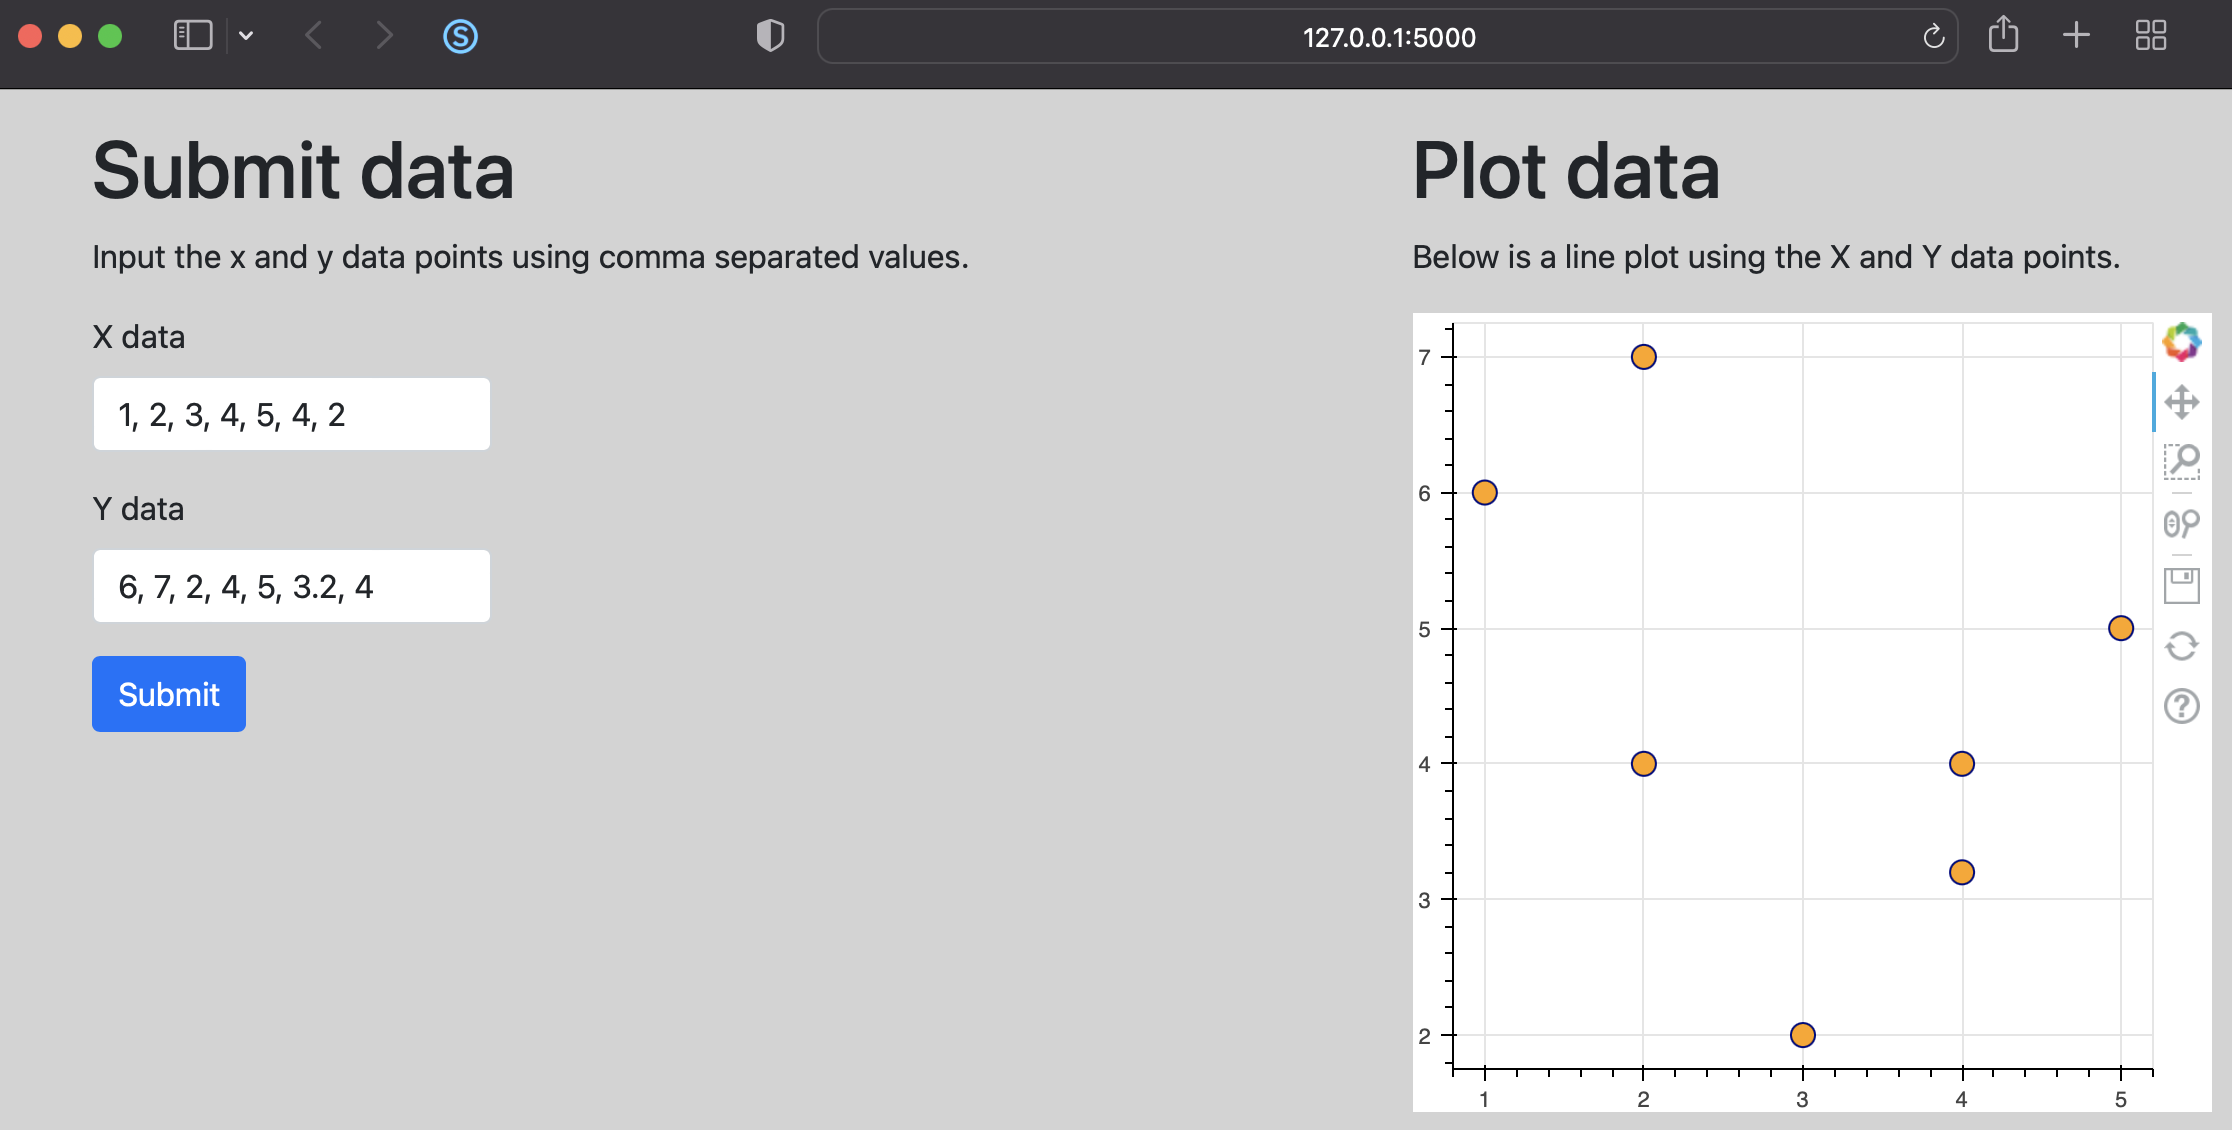
The example below uses Htmx in a Flask app to display a Bokeh graph in a web page without updating the entire page.
The main Flask app is shown below. The Bokeh graph is created in Python then its HTML components are sent to the plot.html template for display on the web page.
from flask import Flask
from flask import render_template
from flask import request

from bokeh.plotting import figure
from bokeh.embed import components


app = Flask(__name__)


@app.route('/')
def index():
    return render_template('index.html')


@app.route('/plot', methods=['POST'])
def plot():
    # Get the form inputs
    xdata = request.form['xdata']
    ydata = request.form['ydata']

    # Convert form input to a list of floats representing x and y values
    x = list(map(float, xdata.split(', ')))
    y = list(map(float, ydata.split(', ')))

    # Create a Bokeh plot using the x and y values
    p = figure(plot_width=400, plot_height=400)
    p.circle(x, y, size=12, line_color='navy', fill_color='orange')

    # Get HTML components to embed in a web page
    script, div = components(p)

    return render_template('plot.html', script=script, div=div)
The index.html template is shown below. Notice how Htmx is used to post the form and target the #graph div on page load as well as form submission. The Bokeh graph displays in the #graph div.
<!-- templates/index.html -->

<!DOCTYPE html>
<html lang="en">
<head>
    <meta charset="utf-8">
    <meta name="viewport" content="width=device-width, initial-scale=1">
    <link href="https://cdn.jsdelivr.net/npm/bootstrap@5.1.3/dist/css/bootstrap.min.css" rel="stylesheet" integrity="sha384-1BmE4kWBq78iYhFldvKuhfTAU6auU8tT94WrHftjDbrCEXSU1oBoqyl2QvZ6jIW3" crossorigin="anonymous">
    <script src="https://cdn.bokeh.org/bokeh/release/bokeh-2.4.2.min.js" crossorigin="anonymous"></script>

    <title>Home Page</title>

    <style type="text/css">
        body { background-color: lightgray; }
        input { max-width: 200px; }
    </style>
</head>
<body>
    <div class="container">
        <div class="row">

            <div class="col">
                <h1 class="mt-3">Submit data</h1>

                <p>Input the x and y data points using comma separated values.</p>

                <form hx-post="/plot" hx-target="#graph" hx-trigger="load, submit">
                    <div class="mb-3">
                        <label for="xdata" class="form-label">X data</label>
                        <input type="text" class="form-control" name="xdata" value="1, 2, 3, 4, 5, 4, 2">
                    </div>
                    <div class="mb-3">
                        <label for="ydata" class="form-label">Y data</label>
                        <input type="text" class="form-control" name="ydata" value="6, 7, 2, 4, 5, 3.2, 4">
                    </div>
                    <button type="submit" class="btn btn-primary">Submit</button>
                </form>
            </div>

            <div class="col">
                <h1 class="mt-3">Plot data</h1>

                <p>Below is a line plot using the X and Y data points.</p>

                <div id="graph"></div>
            </div>

        </div>
    </div>

    <script src="https://unpkg.com/htmx.org@1.6.1" integrity="sha384-tvG/2mnCFmGQzYC1Oh3qxQ7CkQ9kMzYjWZSNtrRZygHPDDqottzEJsqS4oUVodhW" crossorigin="anonymous"></script>
</body>
</html>
The plot.html template that displays the Bokeh components is given below.
<!-- templates/plot.html -->

{% raw %}{{ script | safe }}{% endraw %}

{% raw %}{{ div | safe }}{% endraw %}
Gavin Wiggins © 2025
Made on a Mac with Genja. Hosted on GitHub Pages.