Render a Chart.js Graph with Quart and htmx
Published on December 13, 2025
Tagged with python, javascript, htmx
Quart is an excellent Python web framework with asynchronous features. This example combines Quart with htmx to render and update a Chart.js line chart using data attributes in an HTML response.
Code for the main Quart app is shown below. The home page is the index.html template and the results content is contained in the results.html template. This code just passes the form input to the results template, but a similar approach can be used for a more complicated situation where data might be obtained from computational tasks or a database query.
# app.py

from quart import Quart, render_template, request

app = Quart(__name__)

@app.get("/")
async def root():
    return await render_template("index.html")

@app.post("/results")
async def results():
    form = await request.form
    nums = form["numbers"]

    y = [float(n) for n in nums.split(",")]
    x = list(range(1, len(y) + 1))
    data = {"x": x, "y": y}

    return await render_template("results.html", data=data)

if __name__ == "__main__":
    app.run(debug=True)
The index template is shown here. Notice htmx is used for the form submission and for passing the HTML results response to the results div. The hx-preserve attribute is used on the canvas otherwise the HTML response would replace the canvas after each form submission.
<!-- templates/index.html -->

<!doctype html>
<html lang="en">
  <head>
    <meta charset="utf-8" />
    <meta name="viewport" content="width=device-width, initial-scale=1" />
    <title>Example Chart</title>
    <link
      href="https://cdn.jsdelivr.net/npm/bootstrap@5.3.8/dist/css/bootstrap.min.css"
      rel="stylesheet"
    />
    <script src="https://cdn.jsdelivr.net/npm/htmx.org@2.0.8/dist/htmx.min.js"></script>
    <script src="https://cdn.jsdelivr.net/npm/chart.js@4.5.1/dist/chart.umd.min.js"></script>
  </head>
  <body>
    <main class="container">
      <h1>Example Chart</h1>
      <p>Enter some numbers then submit the form.</p>

      <form hx-post="/results" hx-target="#results">
        <input type="text" name="numbers" class="form-control mb-3" value="1, 12.4, 3, 4, 5.1, 6" />
        <button type="submit" class="btn btn-primary mb-3">Submit Numbers</button>
      </form>

      <div id="results">
        <p>X values are: 0</p>
        <p>Y values are: 0</p>
        <div id="retain" style="max-height: 480px; max-width: 600px">
          <canvas id="myChart" hx-preserve></canvas>
        </div>
      </div>
    </main>

    <script src="{{ url_for('static', filename='linechart.js') }}"></script>
  </body>
</html>
Here is the results template that uses the data provided by the results route in the Quart app. Notice the data-labels and data-values attributes are used to pass the data to the line chart on the home page.
<!-- templates/results.html -->

<p>X values are: {{ data['x'] }}</p>

<p>Y values are: {{ data['y'] }}</p>

<div
  id="retain"
  style="max-height: 480px; max-width: 600px"
  data-labels="{{ data['x'] | tojson }}"
  data-values="{{ data['y'] | tojson }}"
>
  <canvas id="myChart" hx-preserve></canvas>
</div>
Lastly, the JavaScript used to create and update the chart is shown below. The htmx:afterSwap event is used to grab the values from the data attributes then create or update the chart.
// static/linechart.js

let chart = null;

function createChart(labels, values) {
  if (chart) {
    chart.data.labels = labels;
    chart.data.datasets[0].data = values;
    chart.update();
    return;
  }

  const ctx = document.getElementById("myChart");

  chart = new Chart(ctx, {
    type: "line",
    data: {
      labels: labels,
      datasets: [{ label: "Cars", data: values }],
    },
  });
}

htmx.on("htmx:afterSwap", (evt) => {
  const div = document.getElementById("retain");
  const labels = JSON.parse(div.dataset.labels);
  const values = JSON.parse(div.dataset.values);
  createChart(labels, values);
});
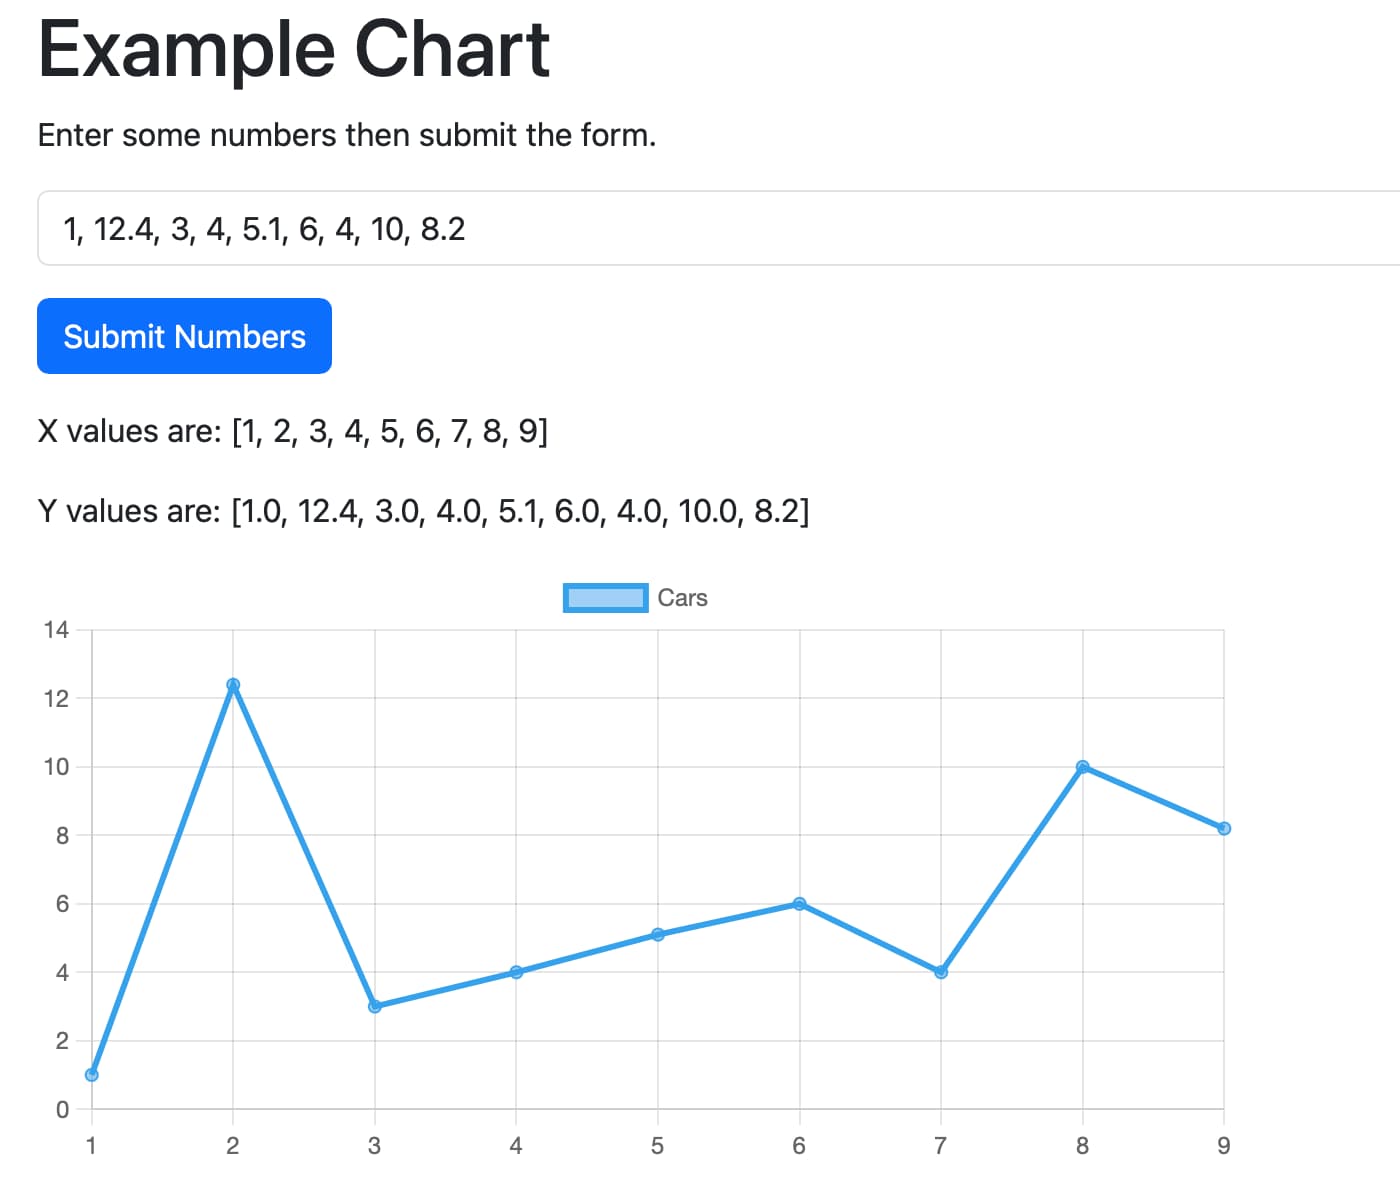
The image below shows the app running in the Safari web browser on macOS. A new line chart is created when the form is first submitted. Editing the numbers and submitting the chart will update the existing chart instead of creating a new one.
Further reading
Code discussed in this article is available in the pythonic/projects/htmx-chartjs directory in the GitHub pythonic repo. Click these links for more information about Quart, htmx, Chart.js, and HTML data attributes.
Gavin Wiggins © 2026
Made on a Mac with
Genja. Hosted on
GitHub Pages.