Plotly Graphs and Htmx with Flask
Published on February 4, 2023
Tagged with python, flask, plotly
Plotly is a great graphing library for scientific applications. Htmx allows you to develop dynamic, interactive web pages without complex JavaScript. The following sections demonstrate a Plotly graph and Htmx with Flask.
Plotly graph
The example below demonstrates using the Plotly JavaScript library in a Flask app.
# app.py

from flask import Flask
from flask import render_template
from flask import request

app = Flask(__name__)


@app.route('/')
def index():
    return render_template('index.html')


@app.route('/plot', methods=['POST'])
def plot():
    xdata = request.form['xdata']
    ydata = request.form['ydata']

    x = list(map(float, xdata.split(', ')))
    y = list(map(float, ydata.split(', ')))
    data = {'x': x, 'y': y}

    return render_template('plot.html', data=data)
The HTML templates used to render the index and plot pages are shown below.
<!-- index.html -->
<!DOCTYPE html>
<html lang="en">
<head>
<meta charset="utf-8" />
<meta name="viewport" content="width=device-width, initial-scale=1" />
<link
href="https://cdn.jsdelivr.net/npm/bootstrap@5.0.0-beta3/dist/css/bootstrap.min.css"
rel="stylesheet"
integrity="sha384-eOJMYsd53ii+scO/bJGFsiCZc+5NDVN2yr8+0RDqr0Ql0h+rP48ckxlpbzKgwra6"
crossorigin="anonymous"
/>
<title>Home Page</title>
<style type="text/css">
body {
background-color: lightgray;
}
input {
max-width: 200px;
}
</style>
</head>
<body>
<div class="container">
<div class="row">
<div class="col">
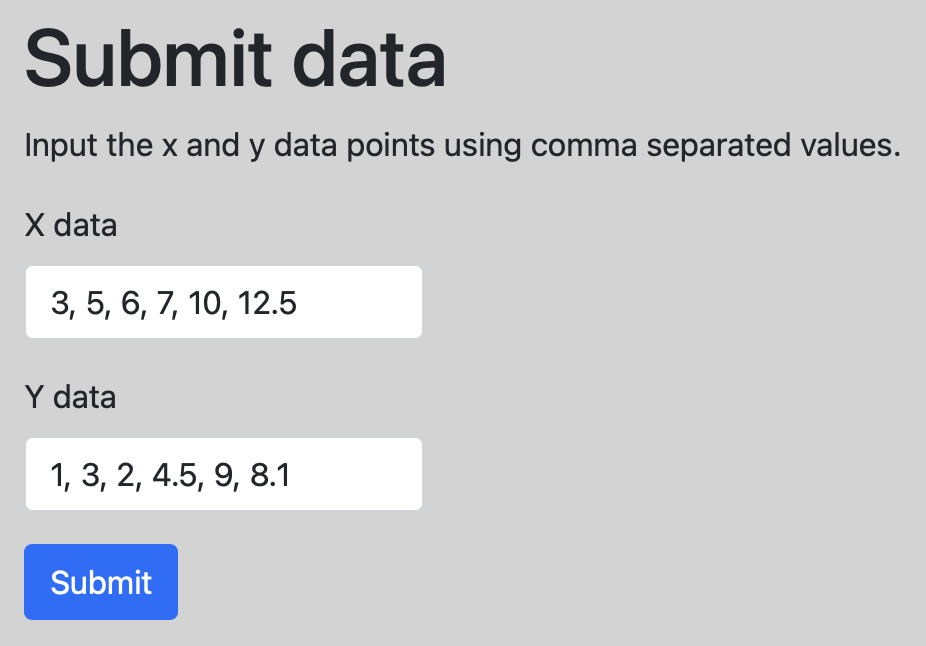
<h1 class="mt-3">Submit data</h1>
<p>Input the x and y data points using comma separated values.</p>
<form action="/plot" method="POST">
<div class="mb-3">
<label for="xdata" class="form-label">X data</label>
<input type="text" class="form-control" name="xdata" />
</div>
<div class="mb-3">
<label for="ydata" class="form-label">Y data</label>
<input type="text" class="form-control" name="ydata" />
</div>
<button type="submit" class="btn btn-primary">Submit</button>
</form>
</div>
</div>
</div>
</body>
</html>
<!-- plot.html -->
<!DOCTYPE html>
<html lang="en">
<head>
<meta charset="utf-8" />
<meta name="viewport" content="width=device-width, initial-scale=1" />
<link
href="https://cdn.jsdelivr.net/npm/bootstrap@5.0.0-beta3/dist/css/bootstrap.min.css"
rel="stylesheet"
integrity="sha384-eOJMYsd53ii+scO/bJGFsiCZc+5NDVN2yr8+0RDqr0Ql0h+rP48ckxlpbzKgwra6"
crossorigin="anonymous"
/>
<script src="https://cdn.plot.ly/plotly-latest.min.js"></script>
<title>Plot Page</title>
<style type="text/css">
body {
background-color: lightgray;
}
</style>
</head>
<body>
<div class="container">
<div class="row">
<div class="col">
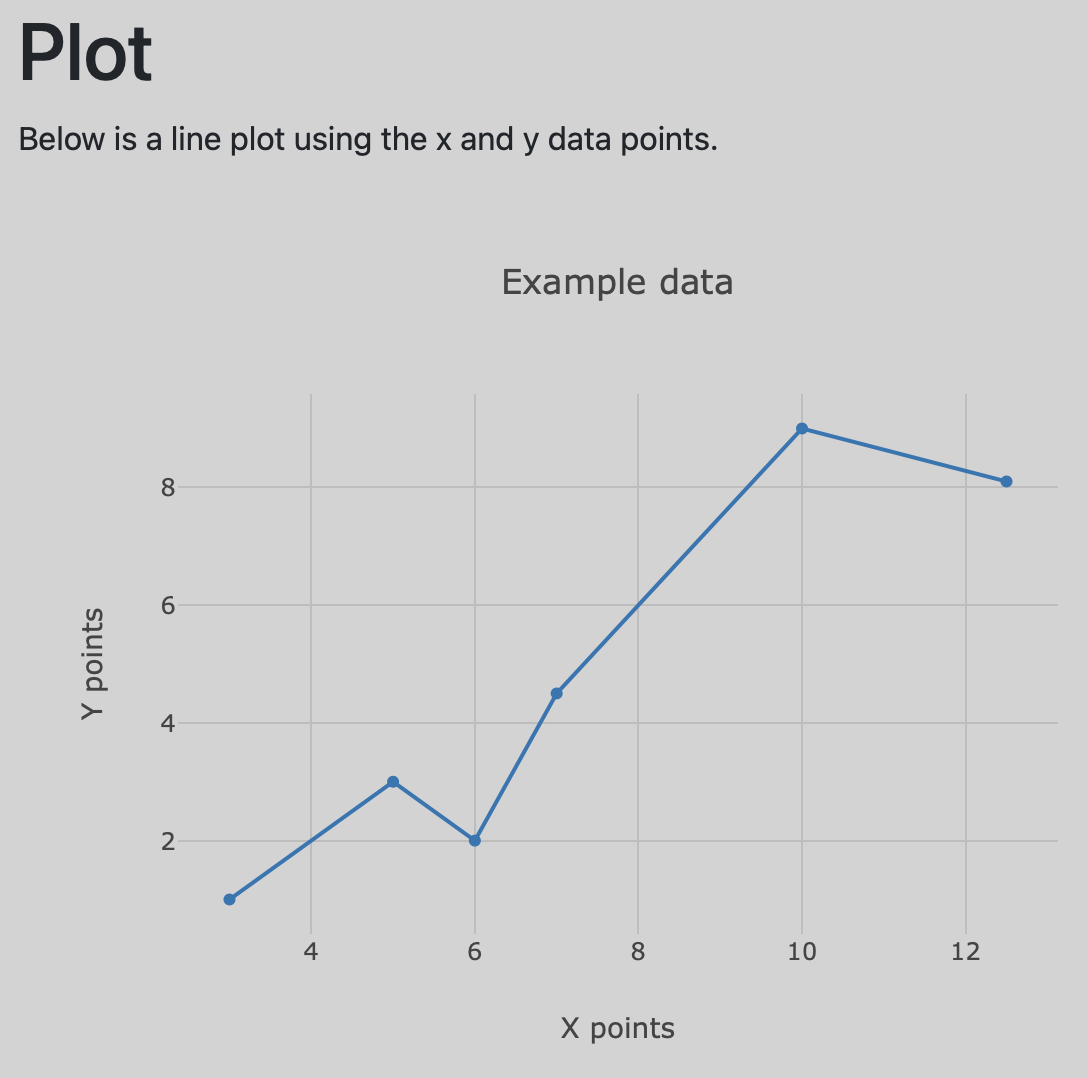
<h1 class="mt-3">Plot</h1>
<p>Below is a line plot using the x and y data points.</p>
<div id="graph" style="width:600px;height:480;"></div>
<script>
var graphDiv = document.getElementById('graph');
var data = [{
x: {% raw %}{{ data['x'] }}{% endraw %},
y: {% raw %}{{ data['y'] }}{% endraw %},
type: 'line'
}];
var layout = {
title: 'Example data',
xaxis: {
title: 'X points',
gridcolor: 'rgb(189, 189, 189)',
},
yaxis: {
title: 'Y points',
gridcolor: 'rgb(189, 189, 189)',
zeroline: false
},
paper_bgcolor: 'rgba(0,0,0,0)',
plot_bgcolor: 'rgba(0,0,0,0)'
};
Plotly.newPlot(graphDiv, data, layout)
</script>
</div>
</div>
</div>
</body>
</html>
Plotly graph with Htmx
The example below uses Htmx in a Flask app to display a Plotly graph in a web page without updating the entire page.
# app.py

from flask import Flask
from flask import render_template
from flask import request

app = Flask(__name__)


@app.route('/')
def index():
    return render_template('index.html')


@app.route('/plot', methods=['POST'])
def plot():
    xdata = request.form['xdata']
    ydata = request.form['ydata']

    x = list(map(float, xdata.split(', ')))
    y = list(map(float, ydata.split(', ')))

    data = {'x': x, 'y': y}
    return render_template('plot.html', data=data)
The html templates used for the Flask app are given below. The Plotly graph is created using the plot.html template.
<!-- templates/index.html -->
<!DOCTYPE html>
<html lang="en">
<head>
<meta charset="utf-8" />
<meta name="viewport" content="width=device-width, initial-scale=1" />
<link
href="https://cdn.jsdelivr.net/npm/bootstrap@5.1.3/dist/css/bootstrap.min.css"
rel="stylesheet"
integrity="sha384-1BmE4kWBq78iYhFldvKuhfTAU6auU8tT94WrHftjDbrCEXSU1oBoqyl2QvZ6jIW3"
crossorigin="anonymous"
/>
<title>Home Page</title>
</head>
<body>
<div class="container">
<div class="row">
<div class="col">
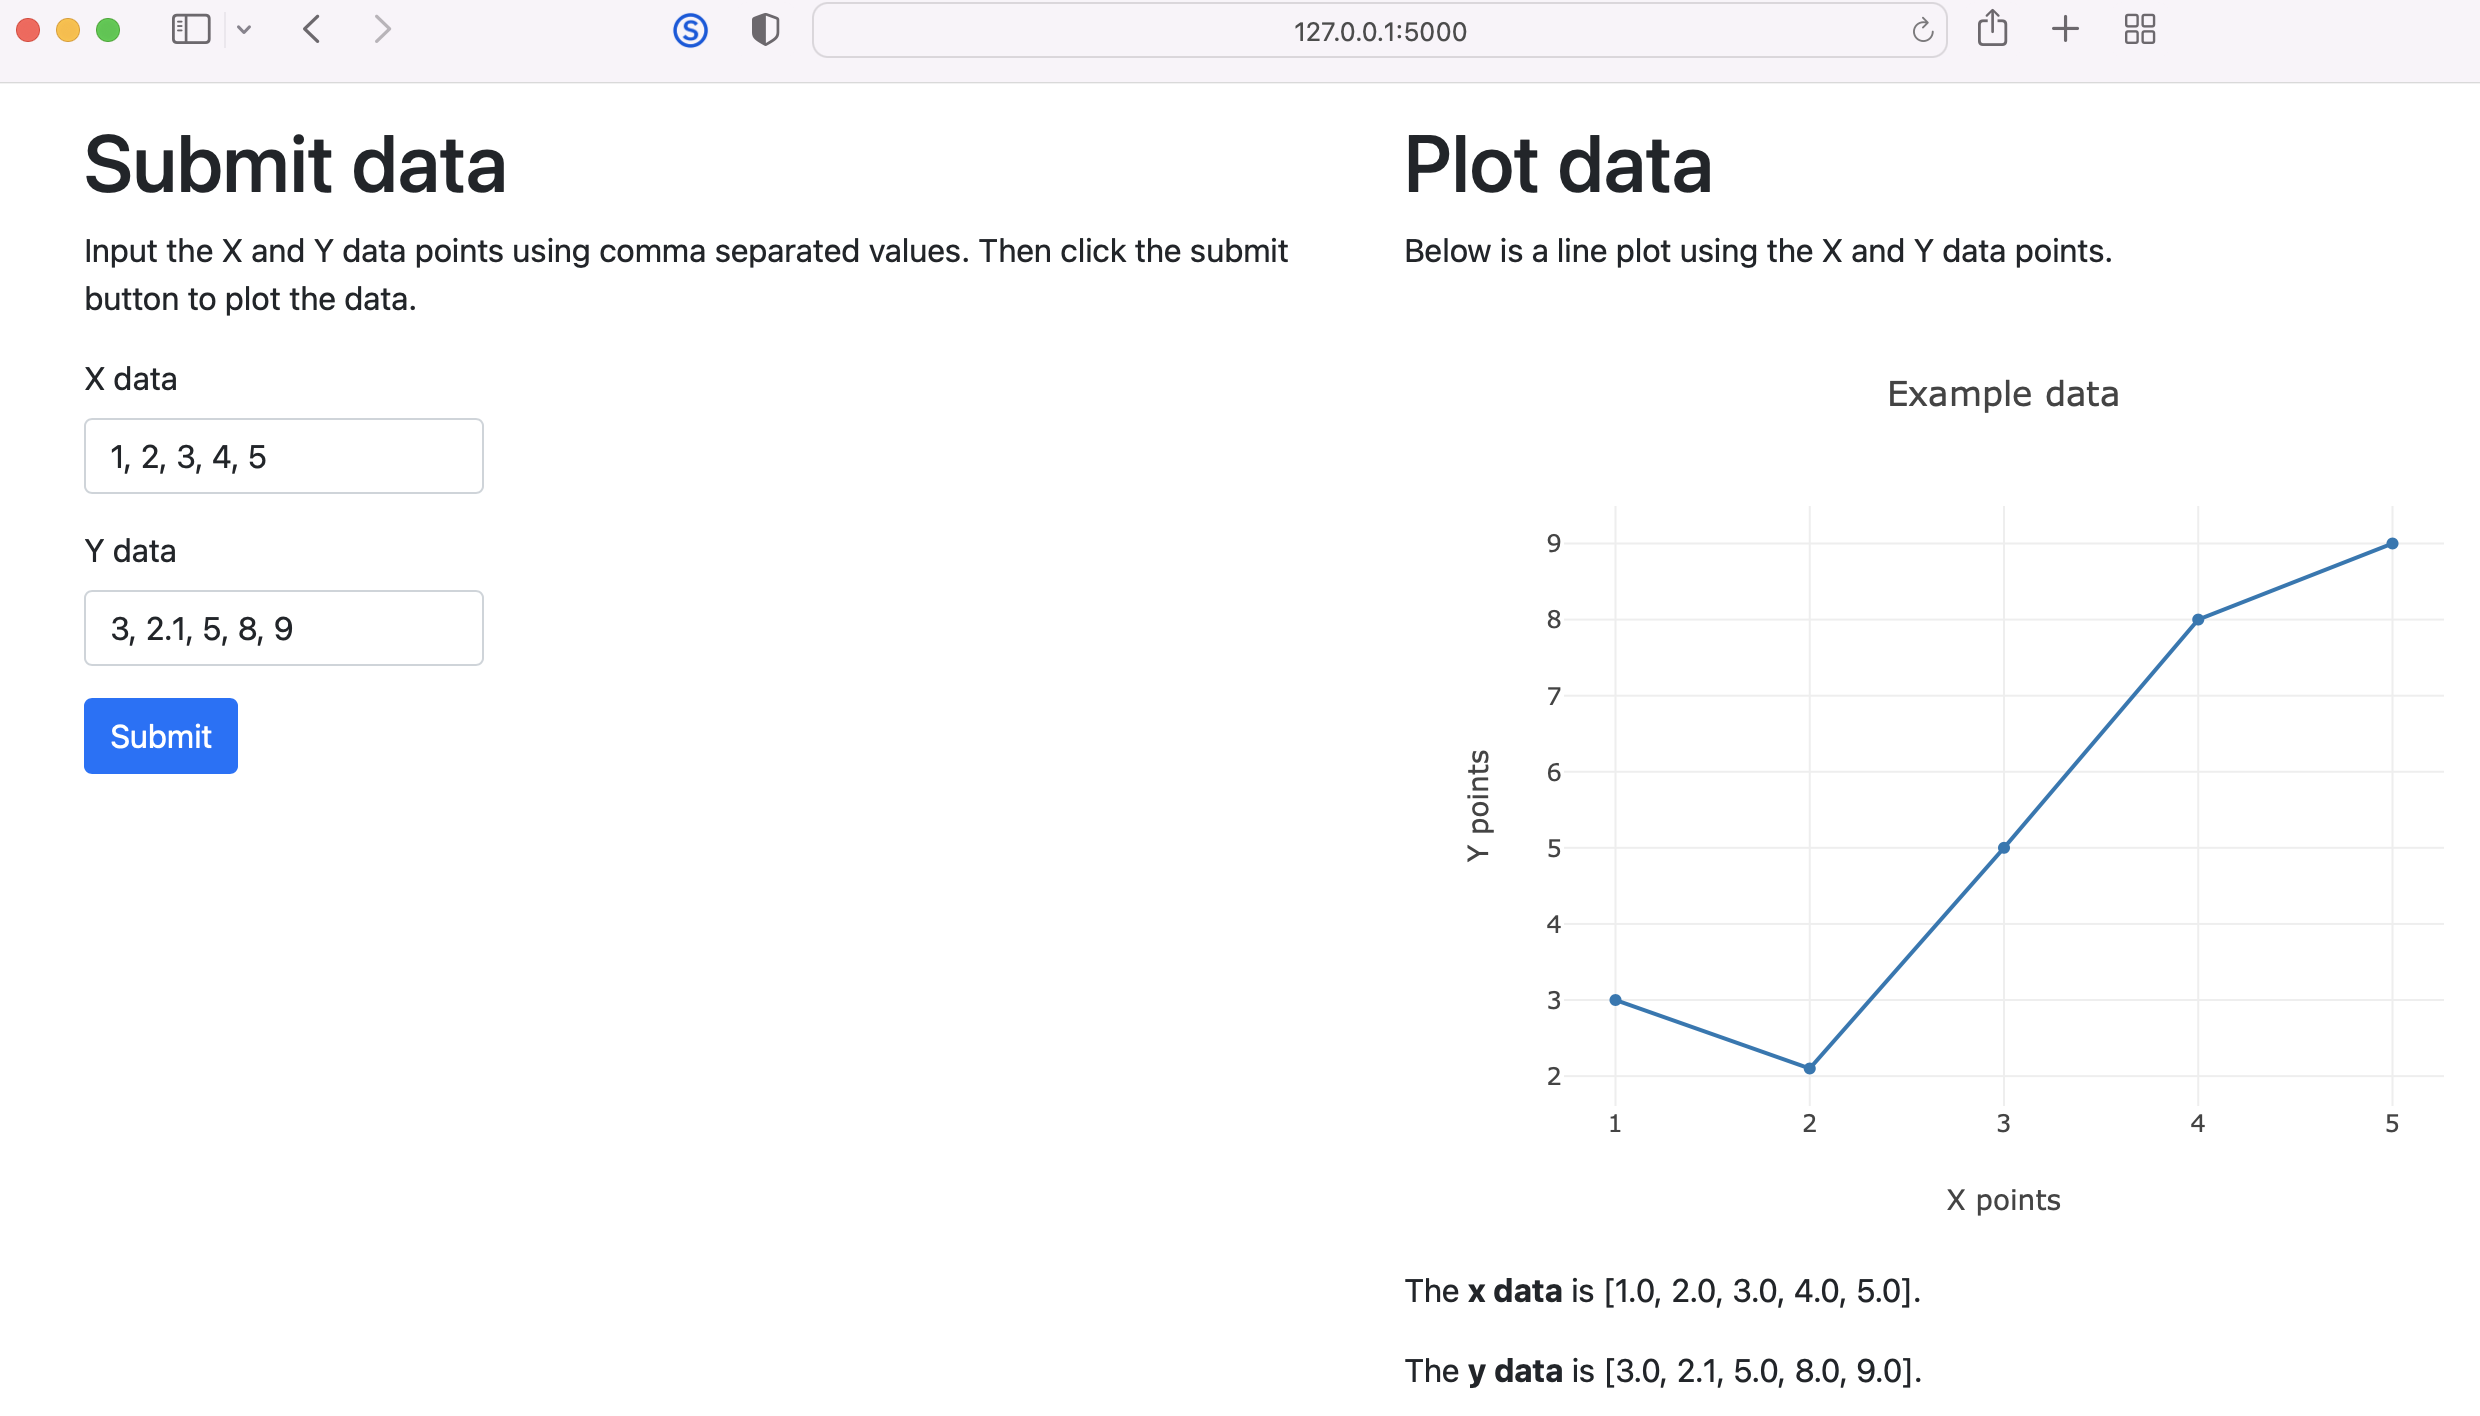
<h1 class="mt-3">Submit data</h1>
<p>
Input the X and Y data points using comma separated values. Then click the submit button
to plot the data.
</p>
<form hx-post="/plot" hx-target="#graph">
<div class="mb-3">
<label for="xdata" class="form-label">X data</label>
<input
type="text"
class="form-control"
style="max-width:200px;"
name="xdata"
value="1, 2, 3, 4, 5"
/>
</div>
<div class="mb-3">
<label for="ydata" class="form-label">Y data</label>
<input
type="text"
class="form-control"
style="max-width:200px;"
name="ydata"
value="3, 2.1, 5, 8, 9"
/>
</div>
<button type="submit" class="btn btn-primary">Submit</button>
</form>
</div>
<div class="col">
<h1 class="mt-3">Plot data</h1>
<p>Below is a line plot using the X and Y data points.</p>
<div id="graph" style="width:600px;height:480px;"></div>
</div>
</div>
</div>
<script
src="https://unpkg.com/htmx.org@1.6.1"
integrity="sha384-tvG/2mnCFmGQzYC1Oh3qxQ7CkQ9kMzYjWZSNtrRZygHPDDqottzEJsqS4oUVodhW"
crossorigin="anonymous"
></script>
<script src="https://cdn.plot.ly/plotly-2.8.3.min.js"></script>
</body>
</html>
<!-- templates/plot.html -->

<script>
  var graphDiv = document.getElementById('graph');

  var data = [{
      x: {{ data['x'] }},
      y: {{ data['y'] }},
      type: 'line'
  }];

  var layout = {
      title: 'Example data',
      xaxis: {
          title: 'X points'
      },
      yaxis: {
          title: 'Y points'
      }
  };

  Plotly.newPlot(graphDiv, data, layout)
</script>

<p>The <strong>x data</strong> is {{ data['x'] }}.</p>

<p>The <strong>y data</strong> is {{ data['y'] }}.</p>
Gavin Wiggins © 2026
Made on a Mac with
Genja. Hosted on
GitHub Pages.