Plotly Graphs in JavaScript
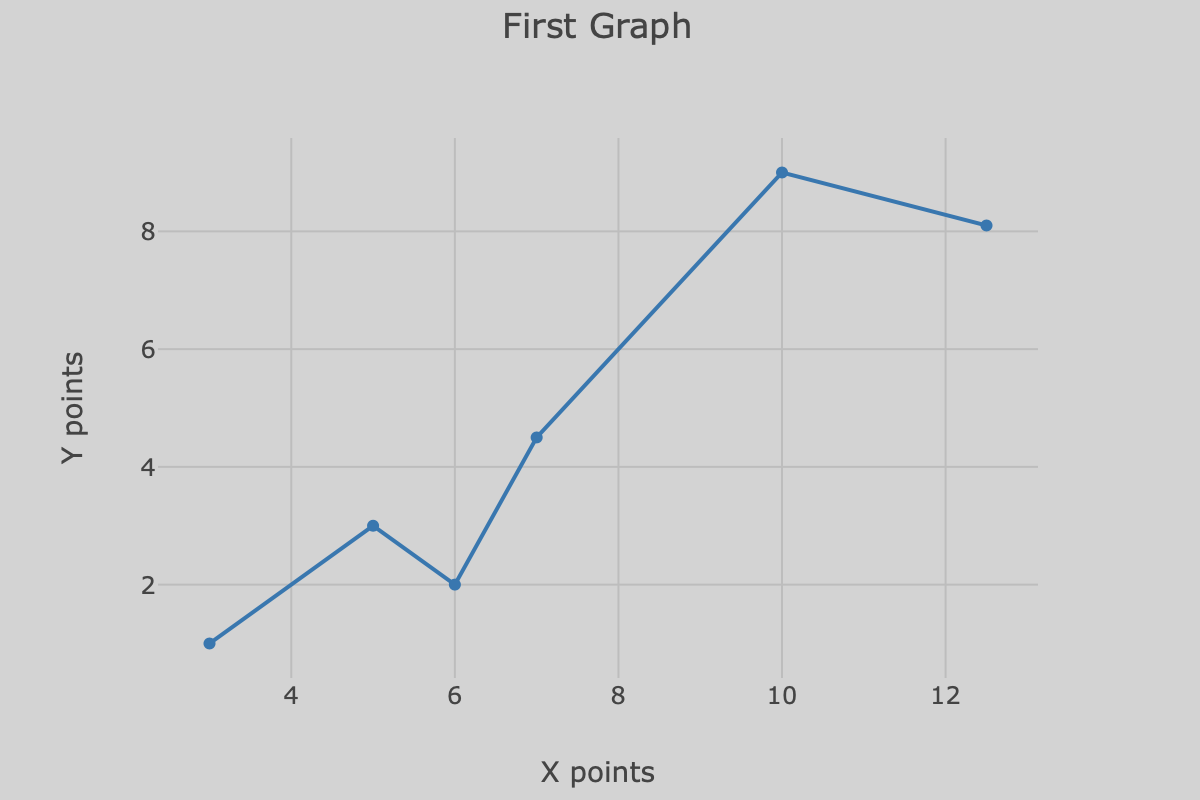
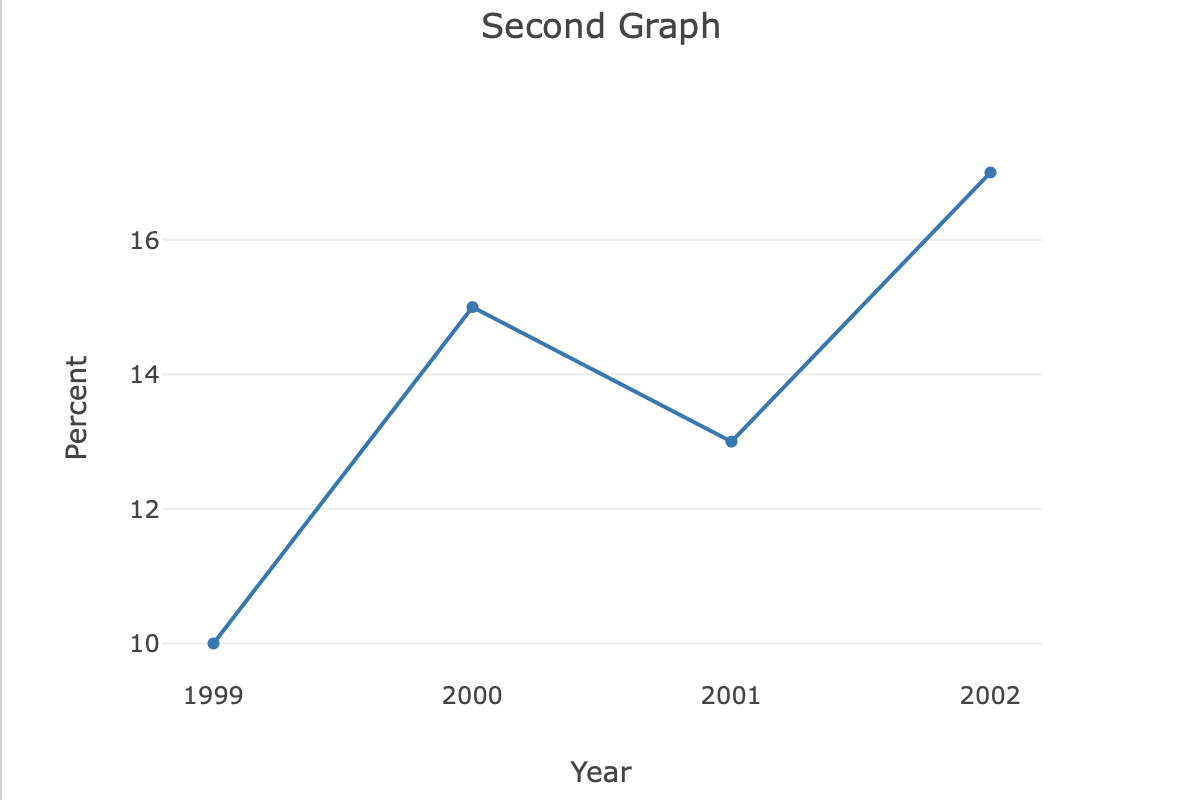
Plotly is an open-source graphing library for JavaScript and other programming languages. Two basic examples are given below. The first graph uses a custom background color to match the web page. The second graph turns off some of the grid lines and uses the default background color.
<!-- index.html -->

<!DOCTYPE html>
<html>
  <head>
    <meta charset="utf-8" />
    <meta name="viewport" content="width=device-width, initial-scale=1" />
    <script src="https://cdn.plot.ly/plotly-latest.min.js"></script>
    <title>Example</title>
    <style>
      body {
        background-color: lightgrey;
        margin: 40px auto;
        max-width: 800px;
      }
    </style>
  </head>
  <body>
    <h1>Plotly examples</h1>

    <div id="graph1" style="width:600px;"></div>

    <div id="graph2" style="width:600px;"></div>

    <script src="app.js"></script>
  </body>
</html>
// app.js

// First graph

const data1 = [{ x: [3, 5, 6, 7, 10, 12.5], y: [1, 3, 2, 4.5, 9, 8.1], type: "line" }];

const layout = {
  title: "First Graph",
  xaxis: { title: "X points", gridcolor: "rgb(189, 189, 189)" },
  yaxis: { title: "Y points", gridcolor: "rgb(189, 189, 189)", zeroline: false },
  paper_bgcolor: "rgba(0,0,0,0)",
  plot_bgcolor: "rgba(0,0,0,0)",
};

Plotly.newPlot("graph1", data1, layout);

// Second graph

const data2 = [{ x: [1999, 2000, 2001, 2002], y: [10, 15, 13, 17], type: "scatter" }];

const layout2 = {
  title: "Second Graph",
  xaxis: { title: "Year", showgrid: false, zeroline: false },
  yaxis: { title: "Percent", showline: false },
};

Plotly.newPlot("graph2", data2, layout2);