Gavin Wiggins
Plotly graph with Htmx and Flask
Written on February 4, 2023
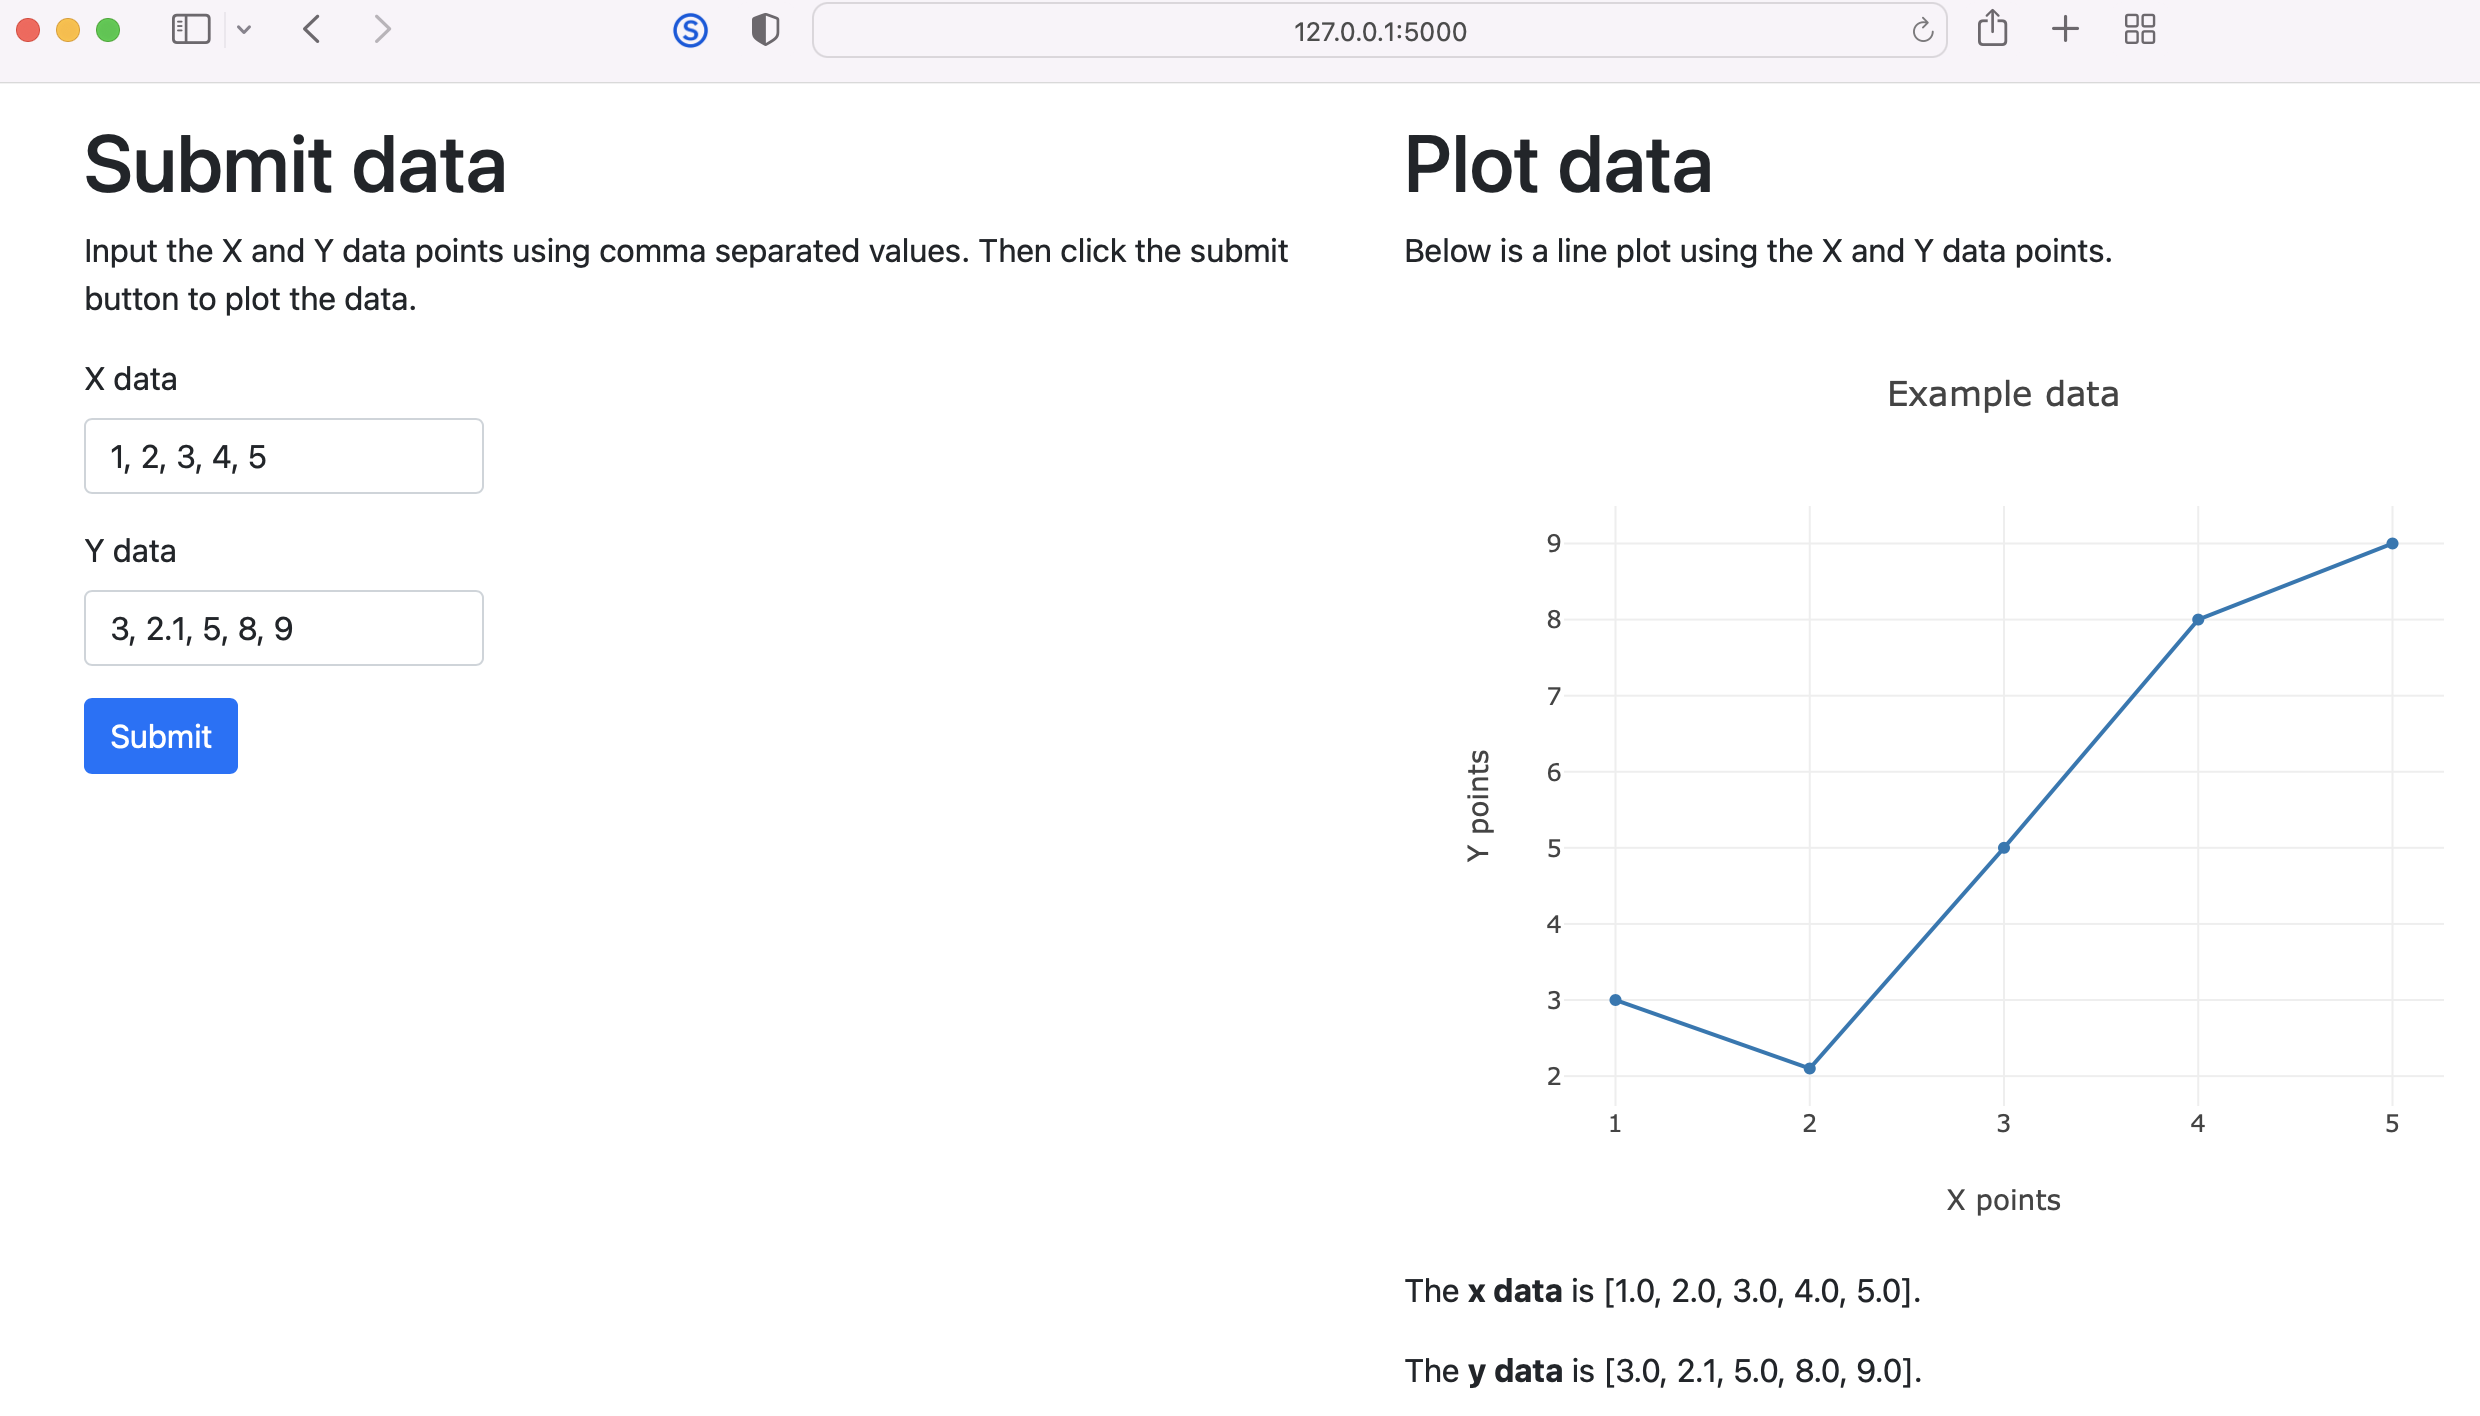
Htmx allows you to develop dynamic, interactive web pages without complex JavaScript. The example below uses Htmx in a Flask app to display a Plotly graph in a web page without updating the entire page.
# app.py

from flask import Flask
from flask import render_template
from flask import request

app = Flask(__name__)


@app.route('/')
def index():
    return render_template('index.html')


@app.route('/plot', methods=['POST'])
def plot():
    xdata = request.form['xdata']
    ydata = request.form['ydata']

    x = list(map(float, xdata.split(', ')))
    y = list(map(float, ydata.split(', ')))

    data = {'x': x, 'y': y}
    return render_template('plot.html', data=data)
The html templates used for the Flask app are given below. The Plotly graph is created using the plot.html template.
<!-- templates/index.html -->

<!DOCTYPE html>
<html lang="en">
<head>
    <meta charset="utf-8">
    <meta name="viewport" content="width=device-width, initial-scale=1">
    <link href="https://cdn.jsdelivr.net/npm/bootstrap@5.1.3/dist/css/bootstrap.min.css" rel="stylesheet" integrity="sha384-1BmE4kWBq78iYhFldvKuhfTAU6auU8tT94WrHftjDbrCEXSU1oBoqyl2QvZ6jIW3" crossorigin="anonymous">

    <title>Home Page</title>
</head>
<body>
    <div class="container">
        <div class="row">

            <div class="col">
                <h1 class="mt-3">Submit data</h1>

                <p>Input the X and Y data points using comma separated values. Then click the submit button to plot the data.</p>

                <form hx-post="/plot" hx-target="#graph">
                    <div class="mb-3">
                        <label for="xdata" class="form-label">X data</label>
                        <input type="text" class="form-control" style="max-width:200px;" name="xdata" value="1, 2, 3, 4, 5">
                    </div>
                    <div class="mb-3">
                        <label for="ydata" class="form-label">Y data</label>
                        <input type="text" class="form-control" style="max-width:200px;" name="ydata" value="3, 2.1, 5, 8, 9">
                    </div>
                    <button type="submit" class="btn btn-primary">Submit</button>
                </form>
            </div>

            <div class="col">
                <h1 class="mt-3">Plot data</h1>

                <p>Below is a line plot using the X and Y data points.</p>

                <div id="graph" style="width:600px;height:480px;"></div>
            </div>

        </div>
    </div>

    <script src="https://unpkg.com/htmx.org@1.6.1" integrity="sha384-tvG/2mnCFmGQzYC1Oh3qxQ7CkQ9kMzYjWZSNtrRZygHPDDqottzEJsqS4oUVodhW" crossorigin="anonymous"></script>
    <script src="https://cdn.plot.ly/plotly-2.8.3.min.js"></script>

</body>
</html>
<!-- templates/plot.html -->

<script>
    var graphDiv = document.getElementById('graph');

    var data = [{
        x: {{ data['x'] }},
        y: {{ data['y'] }},
        type: 'line'
    }];

    var layout = {
        title: 'Example data',
        xaxis: {
            title: 'X points'
        },
        yaxis: {
            title: 'Y points'
        }
    };

    Plotly.newPlot(graphDiv, data, layout)
</script>

<p>The <strong>x data</strong> is {{ data['x'] }}.</p>

<p>The <strong>y data</strong> is {{ data['y'] }}.</p>
Gavin Wiggins © 2025.
Made on a Mac with Genja. Hosted on GitHub Pages.